Last week's analysis concluded by summarizing the situation like this:
"Firstly, looking at support levels, we have 99.15 immediately below. This acted as support yesterday (daily low), after having acted as resistance twice during August, both times as weekly highs. This is resistance turned into support and should now become strong support, especially if it is not reached today. Below that, we have 98.50 which is weaker but has often acted as a price pivot in recent days and weeks. Well below that, we have strong support at around 96.90.
Secondly, points of potential resistance overhead start with the key psychological number of 100.00 where there should be some kind of bounce due to profit taking. Beyond that there is a zone of resistance from around 100.40 to 100.80. Should the USD blast through these levels, it will probably keep going to 103.50. There is also another zone of resistance further on, at around 101.40 to 101.50, but this is likely to be weaker resistance".
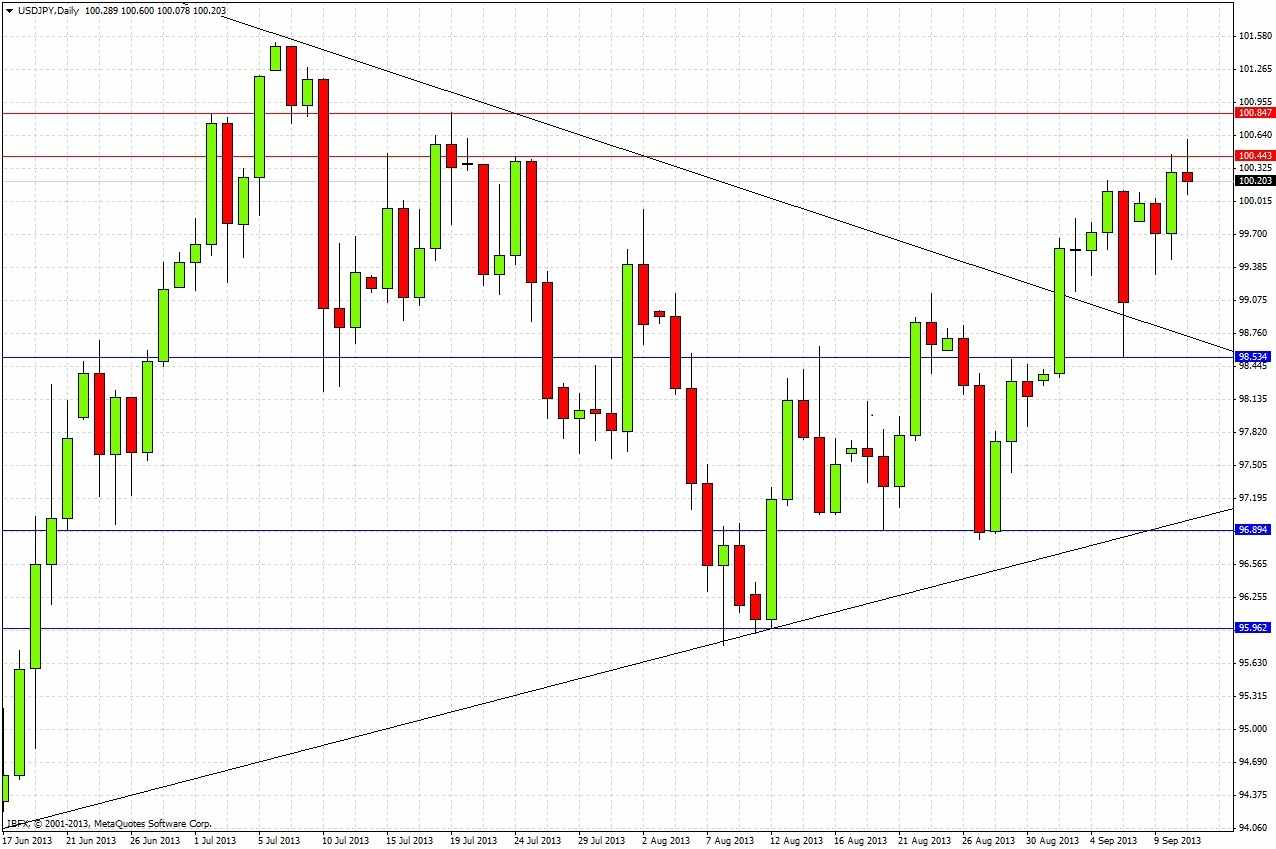
Both the support and resistance levels that were mentioned in the excerpt above were tested, so let’s see how accurate this forecast was by taking a look at the daily chart below:
From the time the previous analysis was published, the price rose steadily, peaking at 100.20, before falling sharply on Friday after the NFP report was released to just a few pips above 98.50. The NFP pushed the price about 35 pips below the support level of 99.15, but the price did recover in the following minutes to return to a level above 99.16, so the level was briefly “respected” before being truly blown away. The levels of 100.00 and 98.50 should certainly have come in useful to traders, as anyone lucky enough to pick up a long on Friday close to 98.50 would have been rewarded quickly with the gap up over the weekend. Already this week price has surpassed the 100.00 level, but is currently respecting 100.40 to 100.80 as predicted. So all in all, this was a pretty accurate and useful forecast, especially as the overall bias of the forecast was strongly bullish.
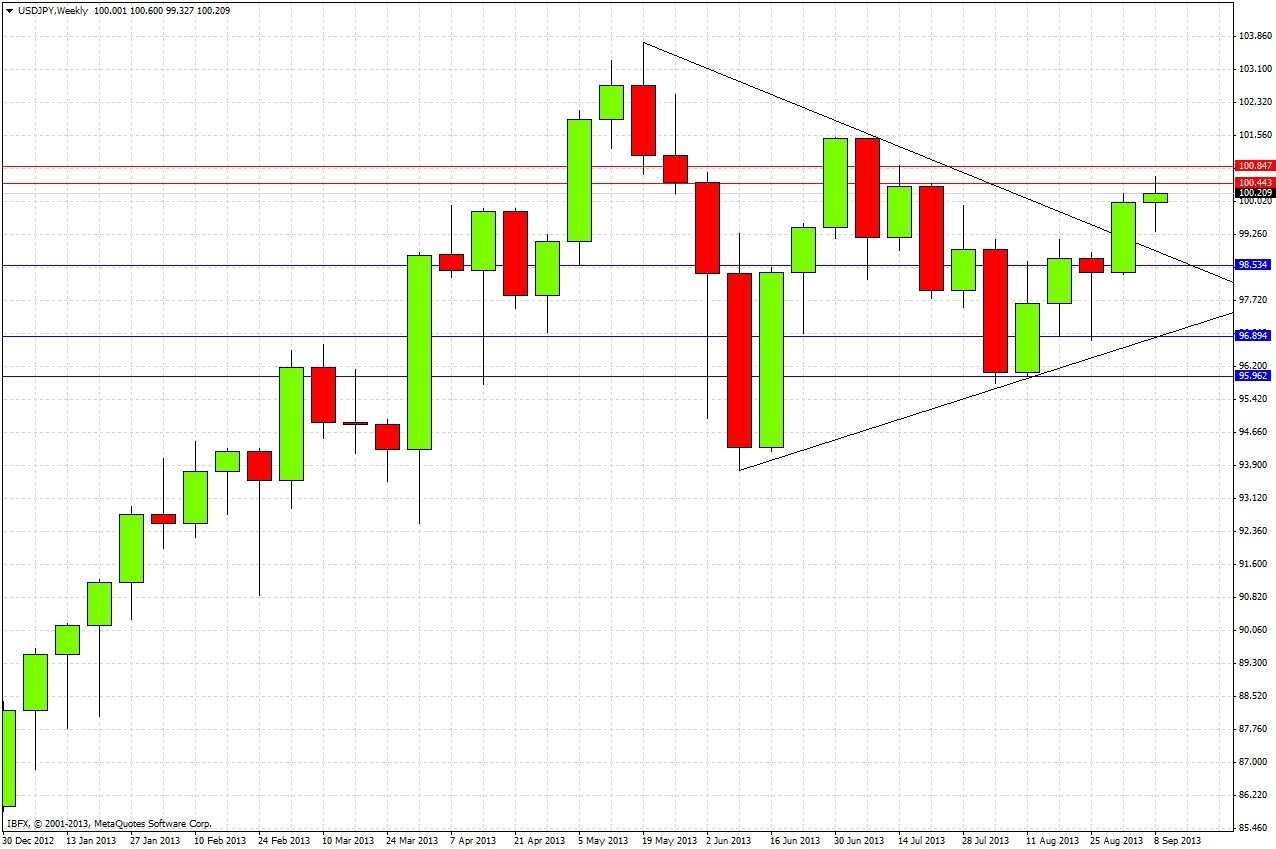
Looking to the future, let's start by examining the weekly chart
Looking at the previous three weeks, the action taken as a whole looks very bullish. Last week saw a strongly bullish breakout from the summer’s triangle with a bullish reversal bar that closed very near its high. Additionally, the week before that was a bullish pin bar, which had formed a double bottom at its low on the key support level of 96.90.
The chart does suggest some resistance overhead at 101.50, the high of the most recent bearish reversal bar that has held to date.
Let's go back to the daily chart above, for greater detail.
Apart from last Friday’s NFP induced trip back to a retest of the broken upper triangle trend line, the action has been almost exclusively bullish. The bullishness was topped off by yesterday’s action, which produced a bullish reversal bar following Monday’s JPY strengthening.
Without any doubt, the overall bias must remain strongly bullish. The major question is whether the resistance from 100.40 to 100.80 is going to be respected in the near future or not. If this area is quickly and strongly breached to the upside, price should power up to 103.50. we can expect 100.85 to be very strong resistance, however. If this area does hold, we can expect a period of consolidation. There is no obvious support level below above 98.55, so traders desperate for a long entry when we are at the lows of any range that develops would be well advised to look for something like a round number such as 99.00, hopefully in conjunction with a pivot or some other supporting indicator. A return to 98.55 would be a good buying opportunity especially if combined with a fast retest of the upper trend line a bit lower.
A consolidation under 100.40 is quite probable, if this builds up plenty of steam it could open up a great bullish breakout play.


