By: Matt Fanning
The Fed Today (9/18) sent most metals flying higher with no reduction in the current QE Bond Buying program, the exact catalyst many metal bulls have been looking for. Copper printed a high of 3.33, closing just off the highs at 3.32. Copper has been in a major Bear market since February ’13, where it put a high in at 3.79. Since then it has declined 21%, all the way down to a low of 2.98. Within the year, this is one of three times Copper printed a low around the 3 handle, proving so far this level is a major bottom for the metal. April and July, Copper climbed to a shorter term high around the 3.37 level. This has been the range since late march, between 3.00 and 3.40. A change of pattern was noticed this month, when the metal held the 3.20 level, which was also its 50 day moving average. This is now current support, and if we break down, would target that 3.00 level again. With the Fed not “Tapering” today, I think this 3.20 level will hold, and in the short term will test the high end of the current range at 3.38. A break of this level would break a 6 month price range, which could prove to be extremely bullish for the metal. If we do break above, next resistance is at 3.43. Above that, we could see a test of 3.54, and more extreme levels would begin to test 3.68 to 3.79.
A Closer Look at the Charts
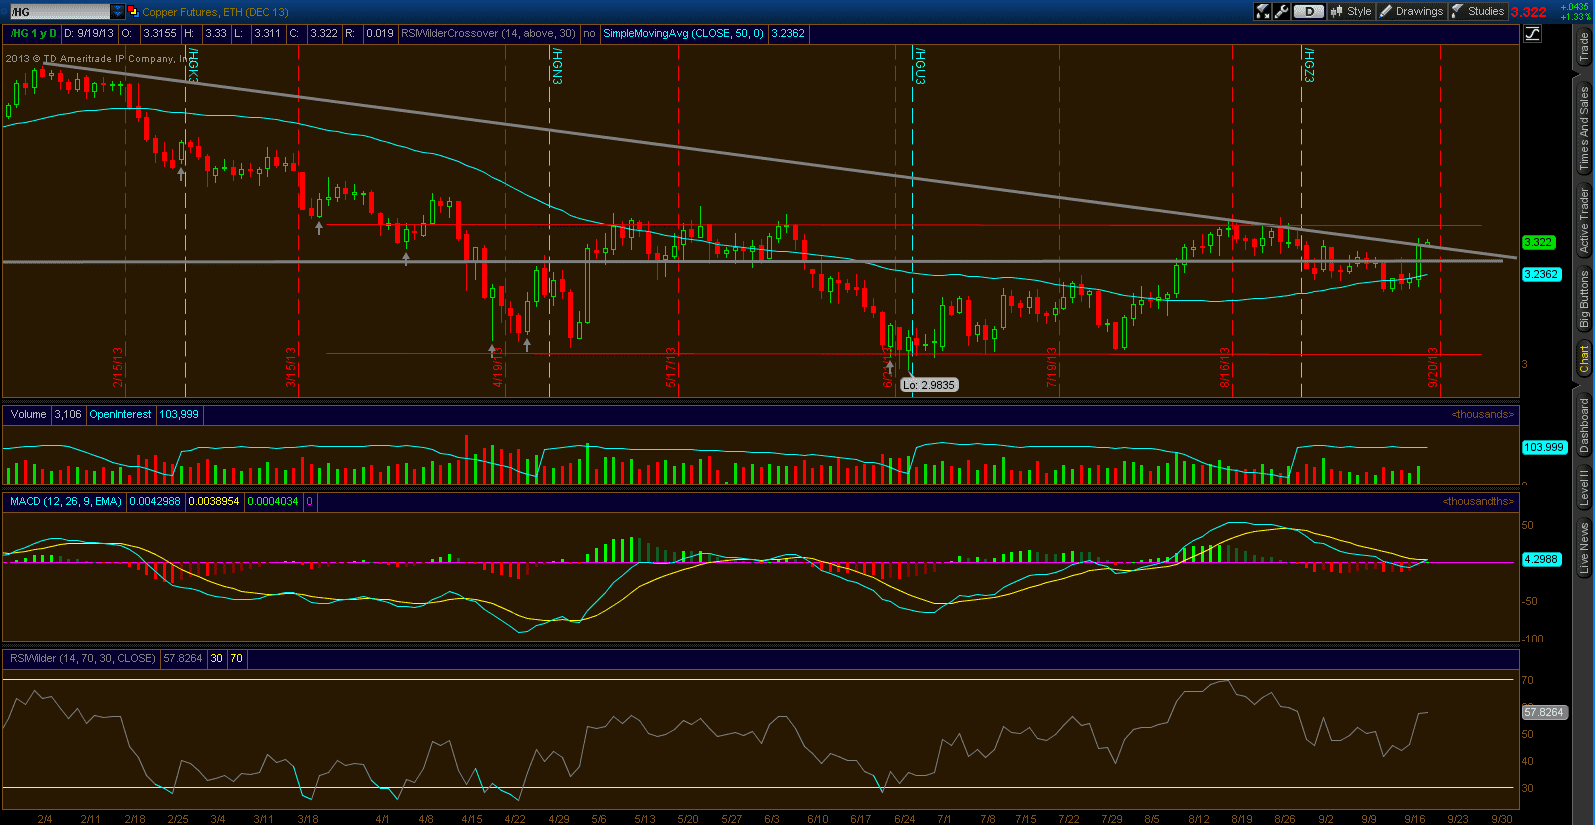
Making the current level more bullish is the break in that long term trend line, as seen in the chart. Although just by a small margin, this is a break of a 7 month downtrend, showing a complete reversal in trend if we can hold above 3.30. Looking at the MACD, we lastly had 15 consecutive days of negative (bearish) divergence, and today marked the first day where this divergence went positive (bullish, blue line crossing over yellow line). Last time this happened was in early August, and the metal rallied about 9%, to current resistance at 3.38. This time we are starting this reversal in trend at 3.30, a measured move would get us to 3.60, which is exactly where resistance is from February.
RSIwilder also looks to be in a bullish trend, starting at the 40 level on the indicator, or a 3.20 price on the metal. We also broke major resistance (56) which has proved to be short-term price resistance points as well. Combining this technical analysis, with the Fed’s decision today, as well as the Housing market rebounding, I am in the Bullish camp for Copper. I will be monitoring this 3.38 level closely to see if it can finally break thru resistance, and would then look for that measured move area of 3.60. Full disclosure, I am currently long SCCO (Southern Copper) for a direct play on Copper (FVAM).