By: DailyForex.com
After failing to break through the 1416 resistance level the XAU/USD pair turned south and gave back all of the gains made in the previous session.
The pair traded as low as 1384.56 after gold mining companies operating in South Africa said they were closer to a wage agreement and the Fed’s Beige Book reinforced expectations that the Federal Reserve would start to cut back its economic stimulus this month.
Lately, the news on Syria overshadowed improving economic indicators and some investors abandoned stocks and flocked to the relative safety of gold. However, I believe how the Federal Reserve plays its cards will have a strong impact in the gold market. The markets will be looking ahead to today's ADP private-sector jobs report and ISM non-manufacturing PMI. From an intra-day perspective, I can say that gold is giving us mixed signals.
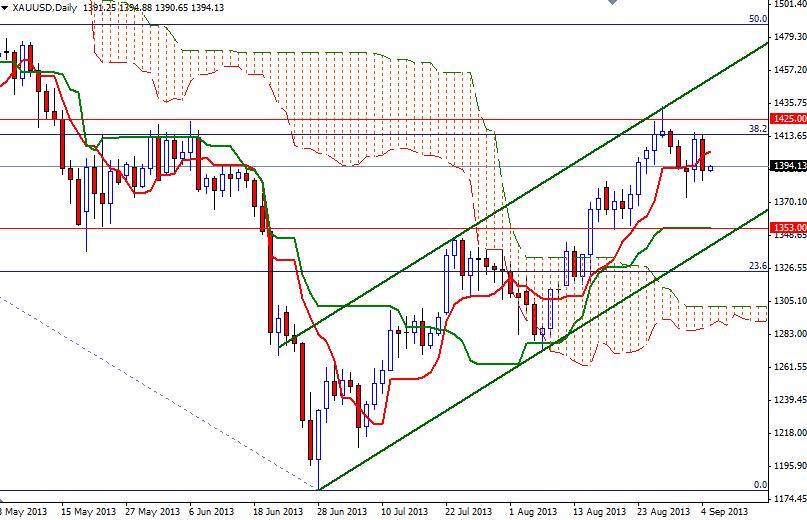
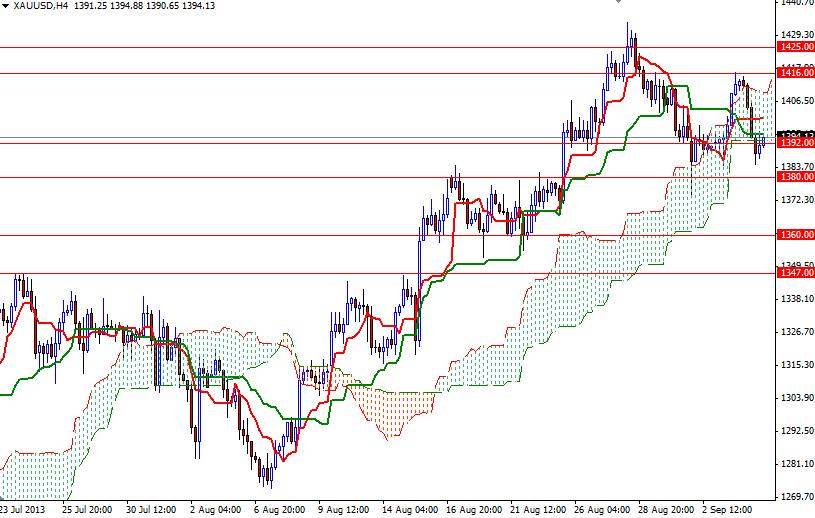
Currently prices are trapped in the Ichimoku cloud on the 4-hour chart and Tenkan-sen line (nine-period moving average, red line) is still above the Kijun-sen line (twenty six-day moving average, green line). This suggests that if the bears increase the selling pressure and drag prices below 1380, then 1360 and 1353 -where the bottom of the ascending channel and the Kijun-sen line coincide- would be the next targets.
In order to regain some strength and challenge the bears at 1416, the bulls have to capture the 1405 level first. A daily close above 1425 would confirm that the momentum is once again turning bullish.