Last Wednesday’s analysis ended with the following recommendations:
"The next key things to watch out for will be whether the support levels at 1.5508 and then 1.5422 breaks to the downside. If at least the first break does not happen soon, the bearish move is likely to be halted. Although we are at support, be cautious about going long now unless the Governor moves the market that way. Conversely, a bearish reversal after a move up to 1.5638 today could be a good opportunity for a short entry. If you are holding shorts, and have not already done so, it would be wise to take some profit now.
If we see a daily close below 1.5421, this is an indication that the price is likely to fall further. Beware of another support level at 1.5350 where there was strong buying following a sharp change in market sentiment about the GBP."
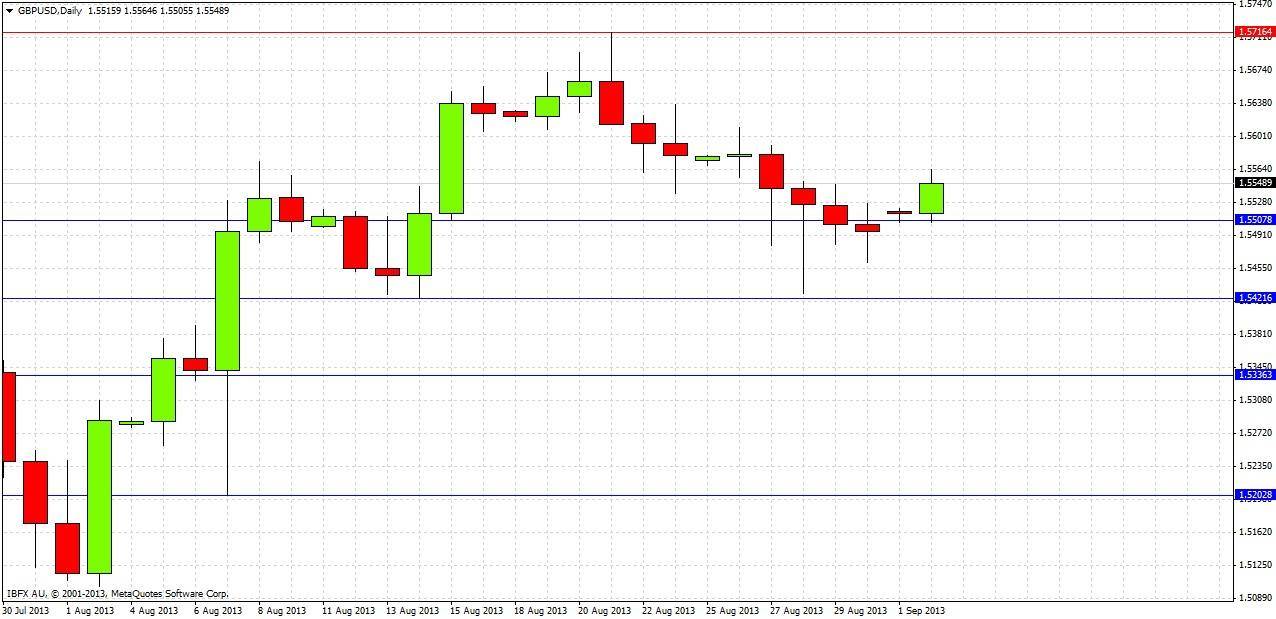
This was a good map for following what actually happened. Over the last 3 days, the weak bearishness has continued, with price falling but coming right back up again. We finally had a daily close below 1.5508 on Thursday, but by very little, and Friday also closed below that level, also by not much. The support at 1.5422 has held easily, in fact it was almost touched last Wednesday but the price was not quite able to even get there.
We can see in the daily chart below that Wednesday printed a pin bar, and that Thursday and Friday’s action were contained as inside bars within the upper two-thirds of the mother pin bar:
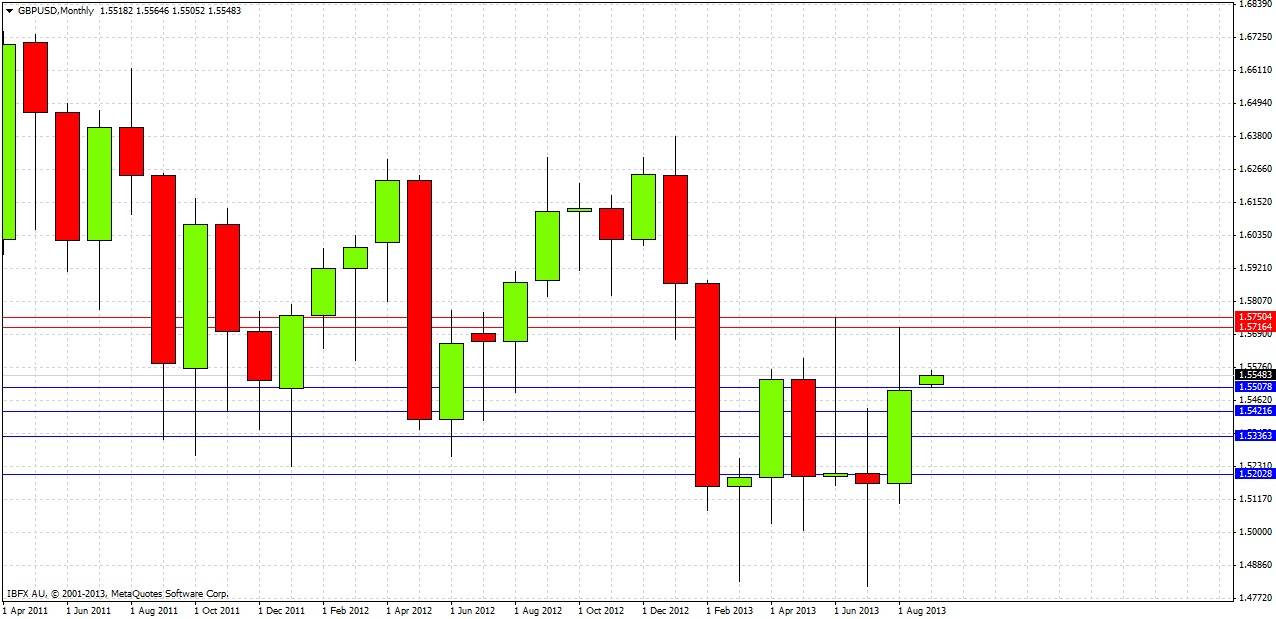
Looking to the future, as it’s a new month let’s start by looking at the monthly chart
We can see that this pair is pretty range-bound, and also that August was a bullish reversal. This suggests that we are going to see a retest of last month’s high at 1.5716 before we reach the low at 1.5102 again.
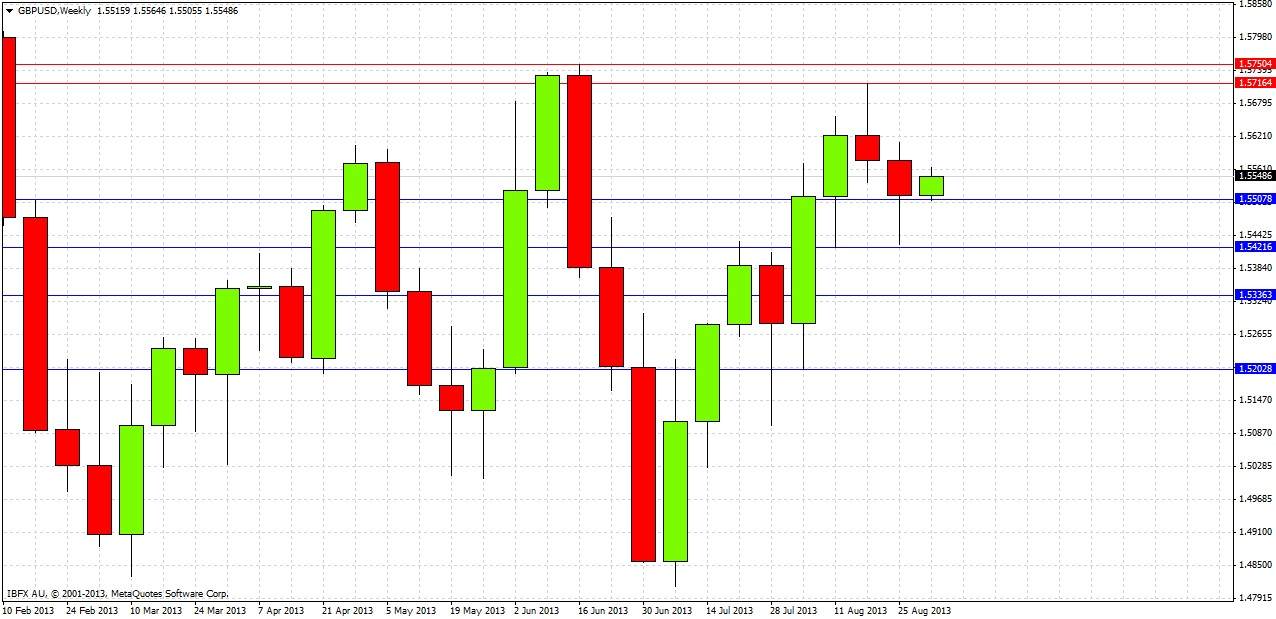
Now for the weekly chart:
Last week’s candle was bearish, closing in the lower half of its range and below the support level at 1.5508, suggesting that last week’s low of 1.5426 and probably the support level just below that at 1.5421 are going to be tested pretty soon. It is likely to hold at the first test for some number of long pips. Above us, last week’s high at 1.5611 is likely to act as resistance. The overall bias should remain weakly bearish.
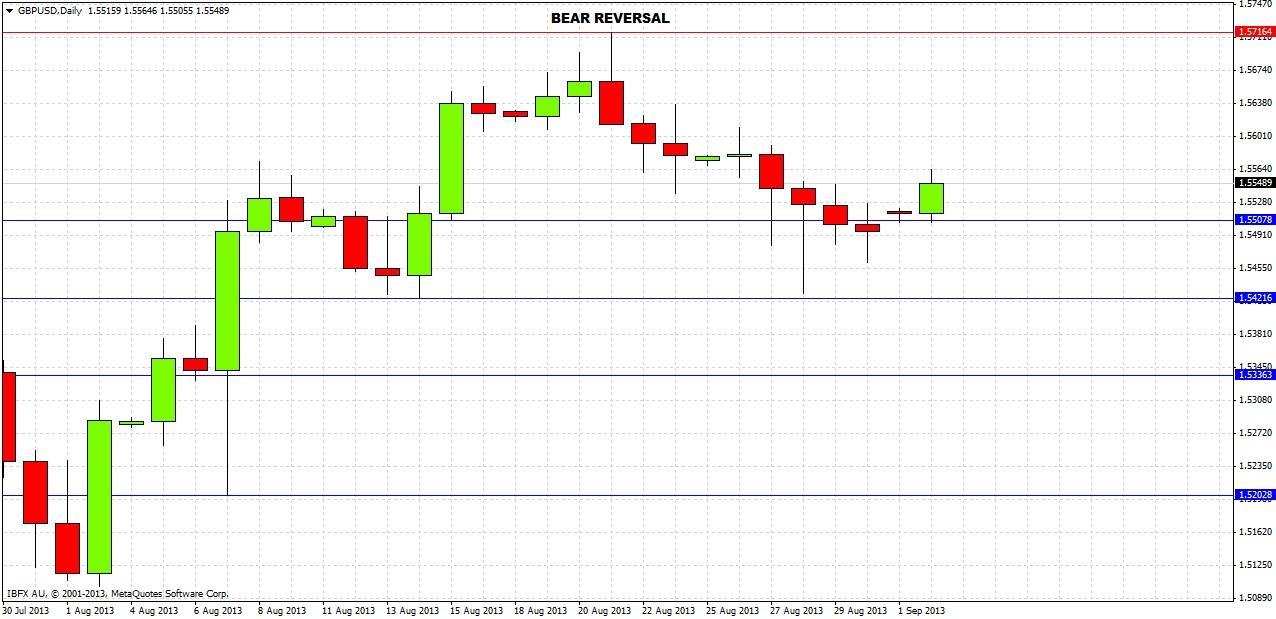
A closer look at the daily chart should reveal more:
The bearish reversal candle at the high of the chart that printed last Wednesday is very significant. Since then, the price has been falling, but nothing very dramatic has happened. There has been support from buying or profit-taking on the way down. The fall has been steady, but quiet so far. In conjunction with the semi-bullish message from our monthly chart, this reinforces our weakly bullish bias, as the sell-off is quiet, and gives us no really key levels beyond those that have already been mentioned. The low of the original bearish reversal candle at 1.5614 is a key level however, this should act as resistance and it is very close to the key weekly level of 1.5611 that was already mentioned. These levels should act as overhead resistance.
The key levels to watch out for are 1.5422 below and 1.5614 above. A reversal off whichever of these levels is reached first could be a good trade. As there is no strong trend, just trading the levels could work well.
If 1.5421 breaks soon and decisively with a daily close below that level, we will probably fall to 1.5350, which should act as strong support.


