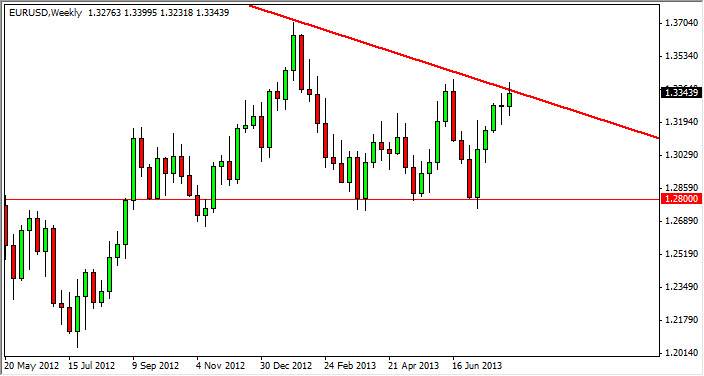
EUR/USD
The EUR/USD pair had an interesting week as it tested the downtrend line that has been forming from the descending triangle. I have talked about this in the past, and it appears that this downtrend line will be violated sooner or later, although Friday certainly was a bit of a pullback. On a daily close above the most recent high which I would put it roughly 1.34, I think that the Euro would continue much higher. Obviously, this pair is being driven by Federal Reserve tapering expectations. That of course changes from minute to minute, so be aware of the fact that headlines will throw this market around drastically. On the other hand, if we do get below the 1.32 handle, I believe that we will eventually have 1.28 as it is the bottom of that shape.
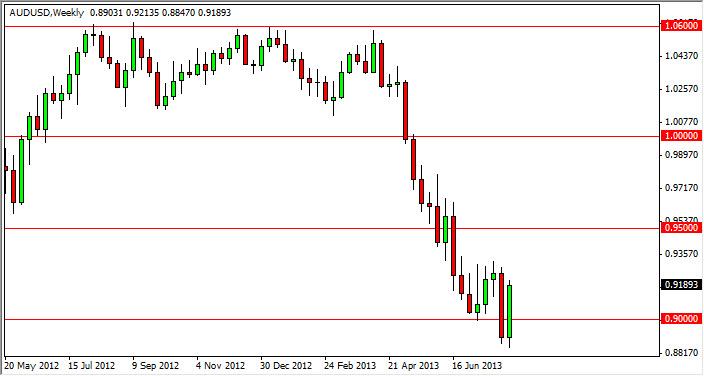
AUD/USD
The AUD/USD pair had a strong showing over the week, closing above the 0.90 handle. This of course is positive, but I still see a lot of noise above until we hit the 0.93 handle. It isn't until we get above there that I would consider buying this pair. I would need to see a daily close above that level in order to be comfortable, and as a result that's what I'm waiting for as far as buying is concerned. On the other hand, a resistive candle between here and there is an excellent selling signal as it coincides with the massive downtrend that we have seen recently.
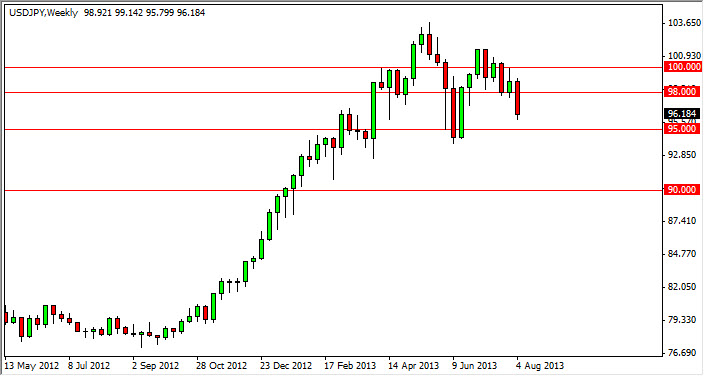
USD/JPY
The USD/JPY pair fell during the session on the balance of the week, but as you can see it appears that we are still going to fall short of breaking down below the 95 handle. I believe that the 95 handle is a significant support zone, and a break below that level will catch the attention of the Bank of Japan. In fact, they have stated recently that they are very comparable with the pair above that level, and somewhere near 100 being the top of the range. Look for words out of Tokyo to throw this pair back up sooner or later, but we do not have a supportive candle do consider looking into buying it at the moment.
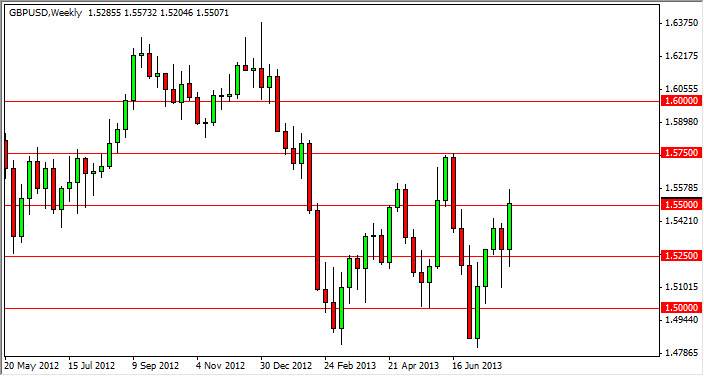
GBP/USD
The GBP/USD pair finished the week of the 1.55 handle, and obviously had a very positive five sessions. However, I think that we will see gains somewhat limited as the 1.5750 level seems to be much more resistive overall. That being the case, I think the pair will rise over the next week, but whether or not it can breakout above there is a completely different story.