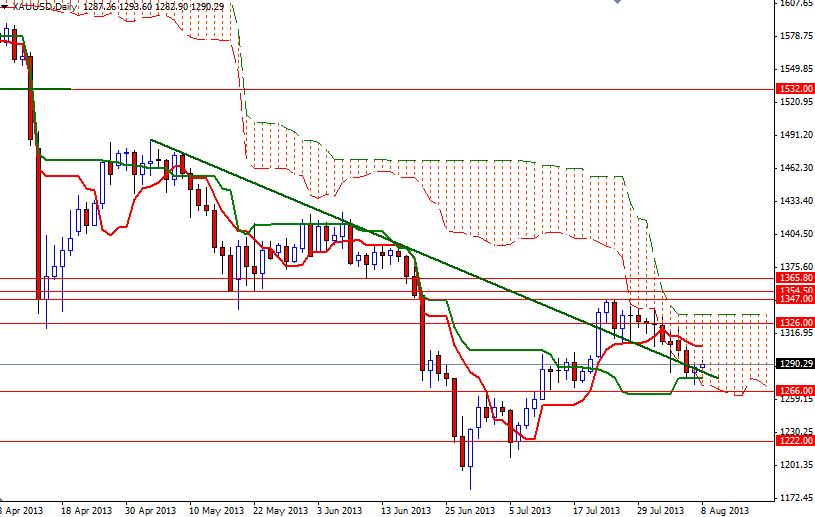
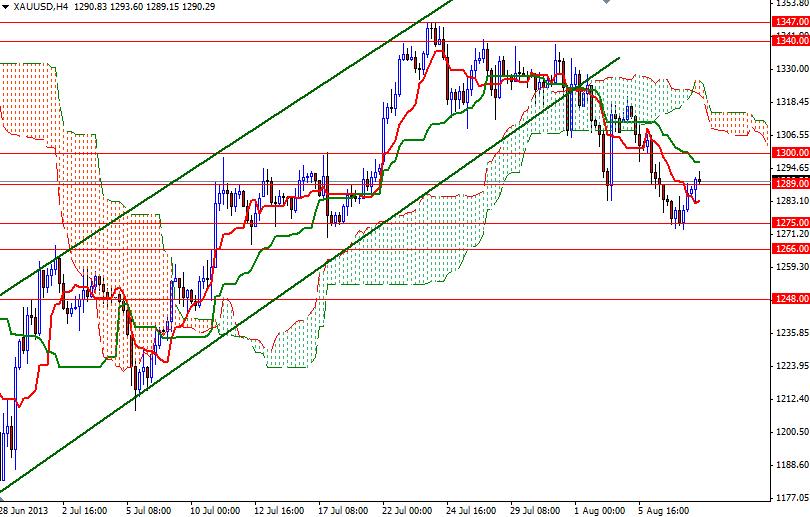
The XAU/USD pair (Gold vs. the American dollar) settled slightly higher yesterday, marking the first rise in eight trading sessions, as caution set in ahead of Chinese trade data and Bank of Japan's monetary policy announcement. The XAU/USD pair found support at 1275 which was the bottom of the previous consolidation area as expected and is currently trading at the 1290.29 level. Although bearish technical formation on the weekly and 4-hour charts suggests there is still some room for the pair to sink, prices are moving inside the Ichimoku cloud on the daily time frame. That means we may see some consolidation in the short term and because of that I think it is technically possible to see pair revisiting the 1314.92 which happens to be the top of the Ichimoku cloud on the 4-hour chart. On its way up, there will be resistance at 1300 and 1306 where the Tenkan-Sen line (nine-period moving average, red line) resides on the daily chart. If the bulls want to dominate the market, they will have to push prices above the 1326 - 1334.07 zone. In order to confirm a bearish continuation, I will be looking for a break below the 1275 - 1266 area. If that is the case, I think we might see 1248 printing on the chart soon after. A daily close the 1248 would make me think that 1222 will be the next stop.