After three consecutive days of gains, gold prices rose to its highest levels since June 19. The XAU/USD pair traded as high as 1379.63 as the American dollar weakened after data on U.S. housing sector and consumer sentiment missed expectations. According to the report released by the University of Michigan, preliminary index of consumer sentiment slipped to 80.0 from 85.1. A separate report showed that building permits climbed 2.7% in July to a 943000 annualized rate but consensus was 950000.
Several economic data will be released from key economies around the world over the week but without a doubt the main event is going to be release of minutes from the Federal Open Market Committee meeting held on July 30-31. Investors think that these records will provide more information about when Federal Reserve policy makers will start to reduce asset purchases so it could be a the catalyst which can determine near-term price movement. Data from the Commodity Futures Trading Commission (CFTC) show that speculative investors increased their net-long position in gold to 53926 contracts, from 51635 a week earlier.
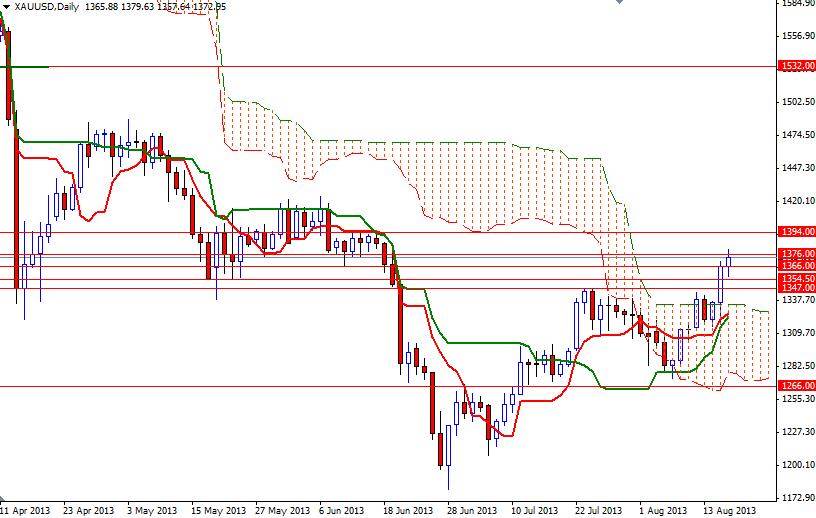
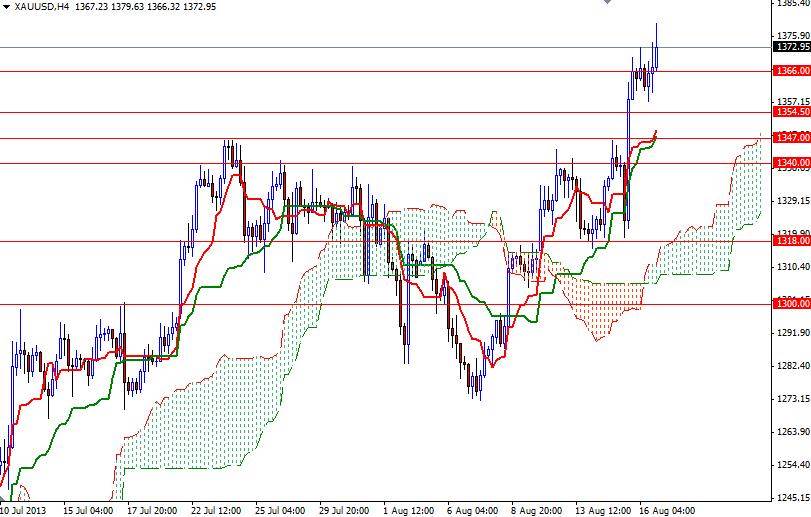
From a technical point of view, short term charts suggest that a bullish continuation towards 1394 is likely if prices climb above the 1376 and break last week's high. However, the area between 1376 and 1425 had been massively resistive in the past so we may see the buyers struggling to break through. Because of that, it is entirely possible to some pull back before heading higher. If the bears take over and gold prices start to fall, there will be support at 1366, 1354.50 and 1347.