My piece last Wednesday ended with the following recommendation:
...if we reach 1.5335 that will undoubtedly be a good place to look for longs. If we break 1.52 at all then we can look for shorts down to 1.51. There is resistance overhead at 1.5730.
Unfortunately, although my generally bullish bias was correct, the price only made it down to a low of 1.5422 before it moved sharply upwards again, so waiting for 1.5335 was a wait in vain.
Let's move ahead and take a closer look at last week's action. Last week's candle was bullish, closing close to its high, following the previous week's bullish reversal candle:
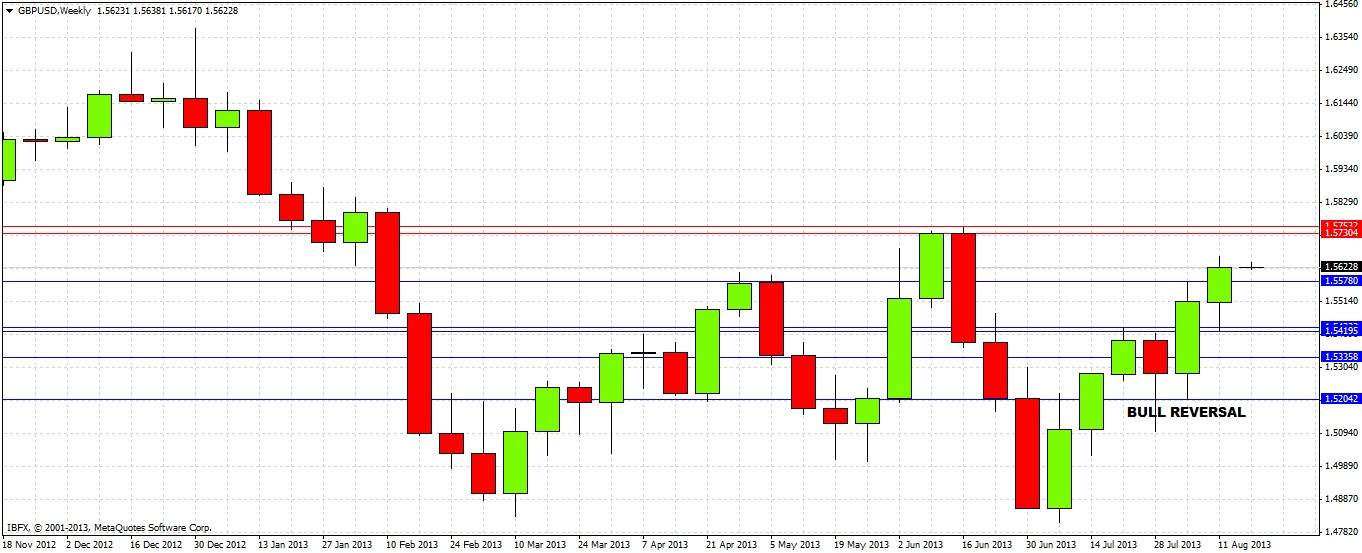
However, we can see that a multi-month high of 1.5750 was formed by a bearish reversal candle last June, with the number itself acting as a key psychological level. This is apt to act as strong resistance overhead.
Turning to the daily chart, of course we also see a very bullish picture, which each of the last two Wednesdays producing strong bullish reversal candles:
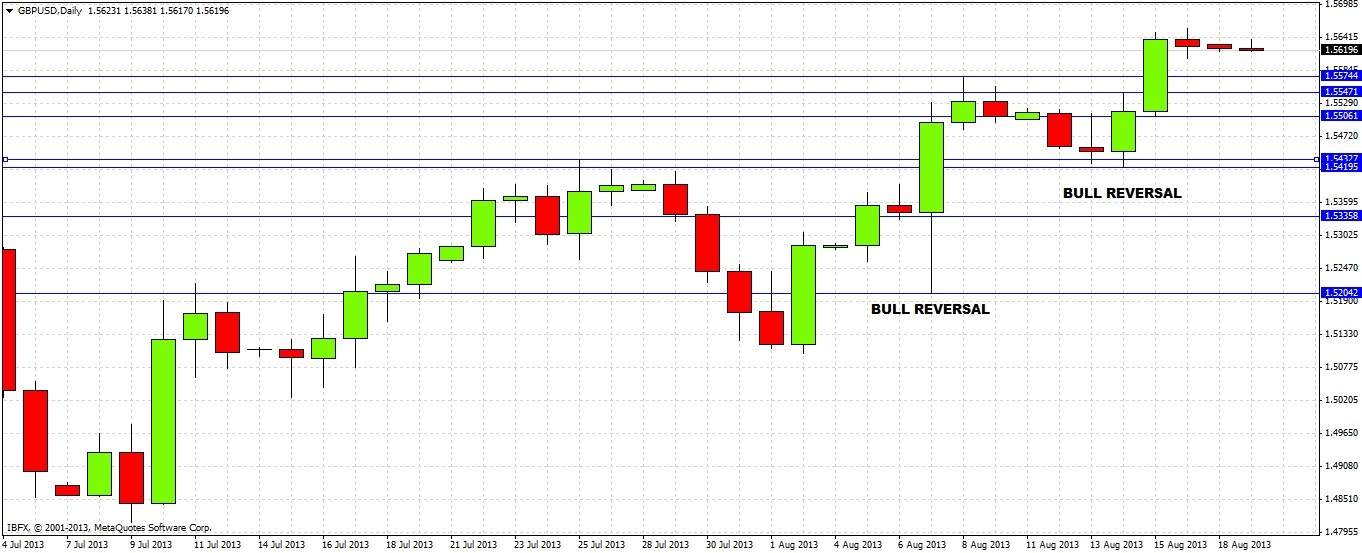
The blue lines mark points that are likely to act as support. The first level of 1.5575 is last week's high, so watch what happens if the price retraces to there. The two levels below that could be a fruitful zone for longs, from around 1.5546 to 1.5505. The levels below that, from 1.5432 to 1.5420, have already acted as strong support and might do so again, so would also be a good zone to take long trades from.
It is possible that the price might go straight up to 1.5750 before hitting any of these levels. In this case scalpers could look for a few short pips off a bounce after a fast run up to this level, and more aggressive traders could try for even more in the right circumstances. It is very likely though that the best money is still to be made on the long side.
This pair is very bullish right now and is actually the key pair in focus within the forex market, so it is definitely worth keeping an eye on further long opportunities. I recommend exiting at least part of any long position at 1.5750 which should prove to be strong resistance before eventually breaking to the upside.
GBP/USD: Bullish Until 1.5750 At Least

Adam Lemon began his role at DailyForex in 2013 when he was brought in as an in-house Chief Analyst. Adam trades Forex, stocks and other instruments in his own account. Adam believes that it is very possible for retail traders/investors to secure a positive return over time provided they limit their risks, follow trends, and persevere through short-term losing streaks – provided only reputable brokerages are used. He has previously worked with...
Read more Adam Lemon began his role at DailyForex in 2013 when he was brought in as an in-house Chief Analyst. Adam trades Forex, stocks and other instruments in his own account. Adam believes that it is very possible for retail traders/investors to secure a positive return over time provided they limit their risks, follow trends, and persevere through short-term losing streaks – provided only reputable brokerages are used. He has previously worked within financial markets over a 12-year period, including 6 years with Merrill Lynch.
As seen on: Pairs Of Aces, FX Street, FX Academy, TalkMarkets, Gold Eagle, Traders Union