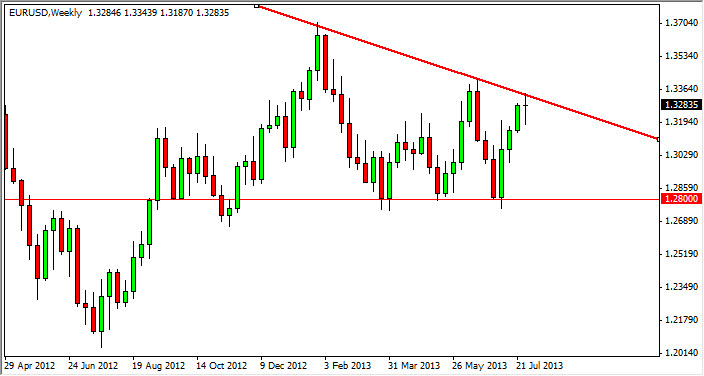
EUR/USD
The EUR/USD finished the week with a neutral candle, although it looks a bit like a hammer. This means to me that the market is probably going to try and run through the downtrend line that is on the attached chart. This would negate the descending triangle that has been forming, and as a result would be very bullish for the Euro. However, if we break the bottom of this “hammer”, it becomes a very negative sign.
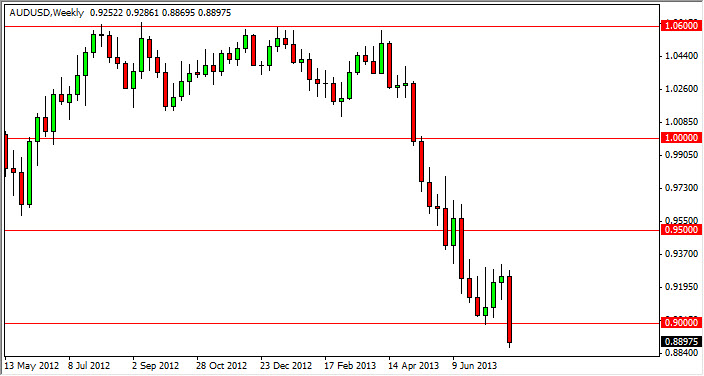
AUD/USD
The AUD/USD pair fell through the all-important 0.90 level this past week, and as a result it looks as if the Aussie is going to continue to head lower, and reach for the 0.85 level soon. This might take a few weeks, but I see no other path for this pair now. Rallies will be selling opportunities in the long run, and a break of the lows from this last week can also trigger more selling.
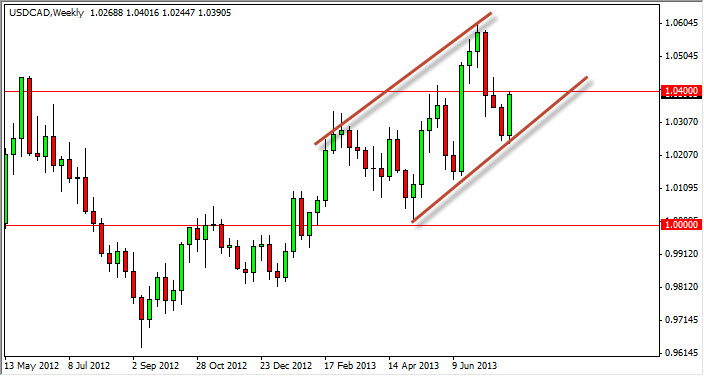
USD/CAD
The USD/CAD pair had a positive showing this last week, slamming into the 1.04 level. This area should be resistive though, so I find it interesting that is essentially where we stopped. In the end though, I think the “channel” I have drawn on the chart will prevail, meaning we should be able to break above it. I feel much better going long above the 1.0450 level though to be honest.
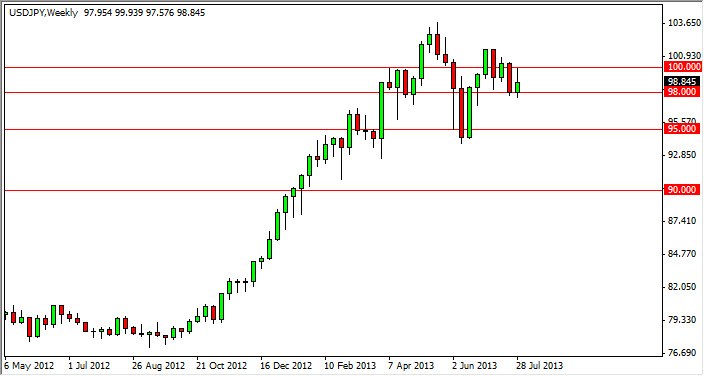
USD/JPY
USD/JPY attempted to rally during the week, and although it formed a green candle – it wasn’t impressive at all. This candle looks like a shooting star, and as a result I feel this market is ready to start falling. However, as you know – I am not a seller. I simply think this allows the market to find support at lower levels – with the 95 handle being the most obvious.
Watch news about the Federal Reserve, and its “tapering” off of quantitative easing. If they do, this should push this pair much higher, and have us clearing the 100 level with ease as the Dollar would continue to gain strength across the board. If they don’t – it throws things up in the air.