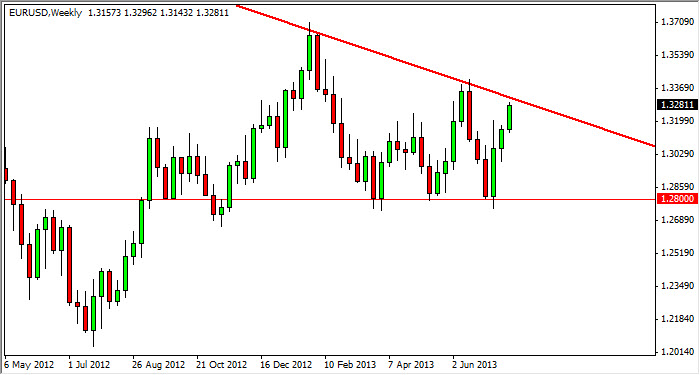
EUR/USD
The EUR/USD pair rose during the previous week, but as you can see stayed well below the downtrend line that formed the top of what looks to be a descending triangle. Because of this, I am a bit hesitant to go along at this point, but do recognize that we closed above this weekly trend line, that is very bullish for the Euro. Otherwise, look for some type of resistive candle to start shorting and aiming for the 1.28 level, which of course is the bottom of this triangle.
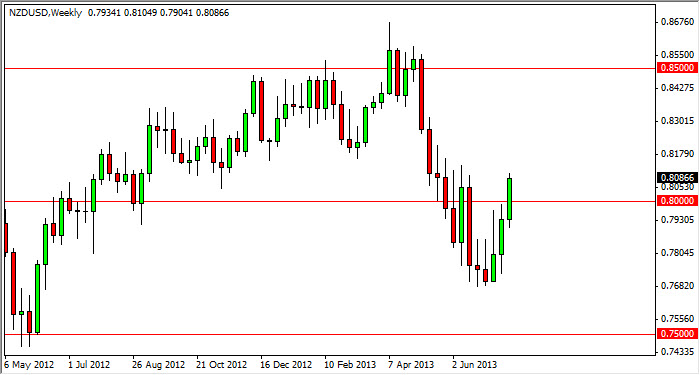
NZD/USD
The NZD/USD pair rose during the previous week, smashing through the 0.80 handle. This of course is very bullish, and I have to comment that I am somewhat surprised that we got above here. However, I can see a cluster of resistance around the 0.82 handle, so I'm not ready to declare this market a buy yet. However, I do think that the potential is there. I will be looking for a resistive candle to sell, I think that's the path of least resistance, but if I don't get it I would be more than willing to go ahead and buy above the 0.82 handle as it would show momentum completely being reversed.
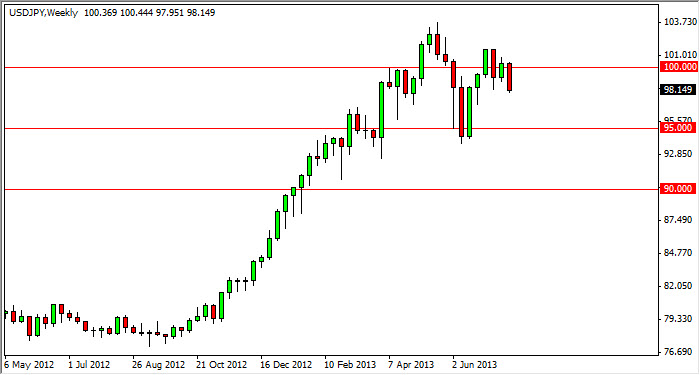
USD/JPY
The USD/JPY pair had a bearish week, but what I find interesting is that we stopped at the 98 handle. This area has been supportive time and time again, and as a result I see no reason why won't be now. However, I think that's minor support and if we do manage to break below that it does not change my opinion of this pair overall. I still think the 95 handle is the "floor" in this marketplace, and would not hesitate to start buying there. Otherwise, a move back above 100 gets me interested for the long-term.
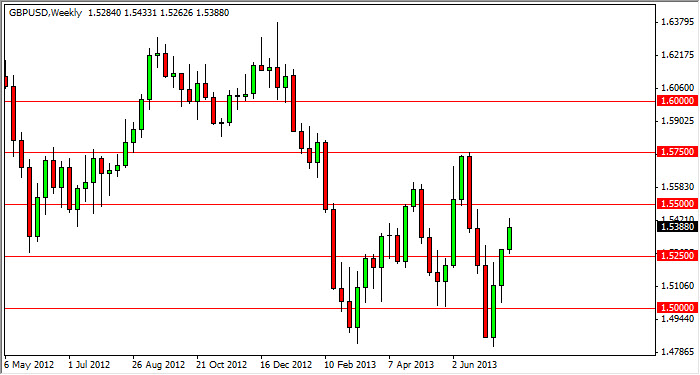
GBP/USD
The GBP/USD pair rose during the course of the week, as you can see closed just underneath the 1.54 level. However, it does appear that we are going to head towards 1.55 level, an area that I think will be rather resistive. Quite frankly, for the longer-term trader I think it's more prudent to simply wait for resistance over there in order to start selling. If we do manage to fall below the 1.5250 level before that though, I think that would be a very bearish sign.