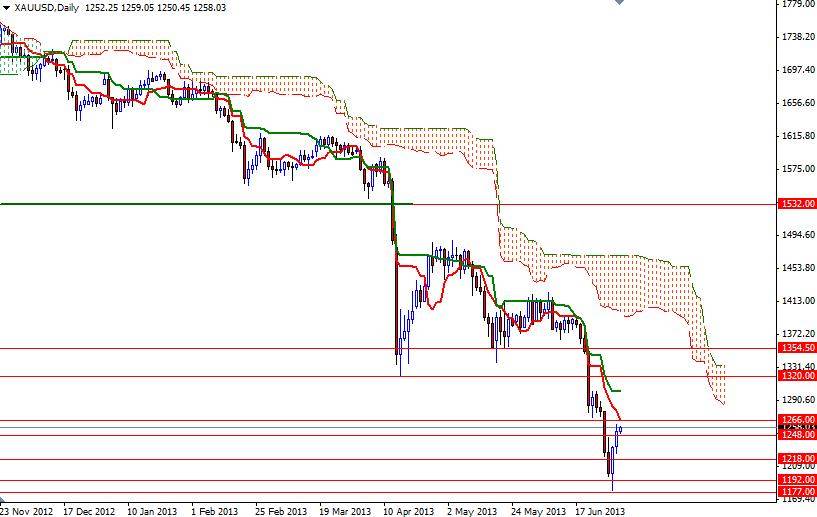
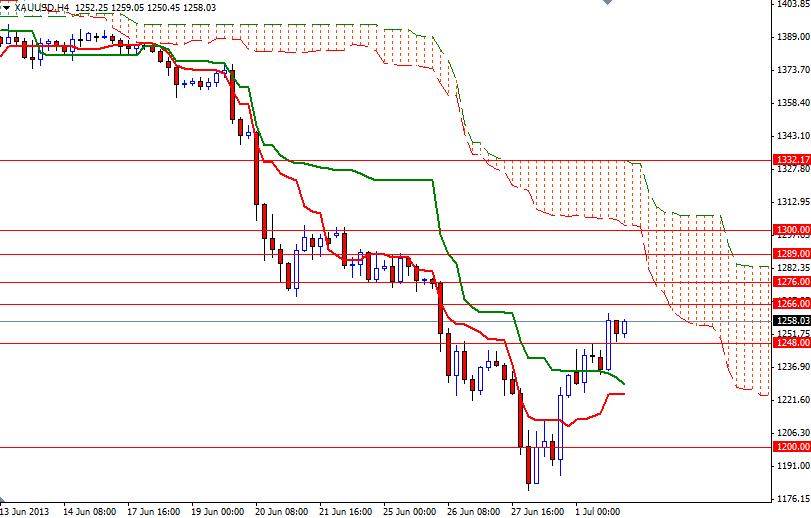
The XAU/USD pair continued to recover some of last week's losses but weak manufacturing purchasing managers’ index data out of China, the world's second biggest gold consumer, limited the shiny metal's gains. Official PMI data showed that the index fell from 50.8 to 50.1, while HSBC reported that its own PMI dropped to 48.2 from the prior period’s 49.2. U.S. Markit and ISM manufacturing PMI data were mixed. From a technical point of view, the weekly and daily charts will remain bearish while the pair is trading below the Ichimoku clouds and the Tenkan-Sen line (nine-period moving average, red line) is below the Kijun-Sen line (twenty six-day moving average, green line). However, pattern on the daily charts suggests that the technical selling pressure is losing momentum. This makes me think that the XAU/USD pair might be heading towards the 1289 - 1300 area in the short term. Prices have been slightly bullish during the Asian session today but market participants might be waiting for Friday's official U.S. employment data before putting larger bets. In addition, plenty of economic data will be released from key economies around the world over the week as well. Today the key levels to watch will be the 1248/0 and 1266 levels. If gold prices continue to hold above the 1248/0 area, it is likely that the bulls will try to break above the 1266 level. If the XAU/USD pair breaks through the 1266 level, I will be looking for 1276 and 1289 next. Above 1289, I see a strong resistance zone between the 1300 and 1320 levels and I guess this is where the real fight is going to happen. If the bears manage to push prices below the 1248/0 area, there will be additional support at 1229/2. A daily close below this area would probably take us back to the 1200 level.
Gold Price Analysis - July 2, 2013
By Alp Kocak
Subscribe Sign up to get the latest market updates and free signals directly to your inbox. *By registering you agree to receive communications.
Please enter a valid email address

By Alp Kocak
Alp Kocak has been trading Forex since 2003. He writes technical analysis based on Japanese candlesticks and Ichimoku Kinko Hyo.
- Labels
- Gold

