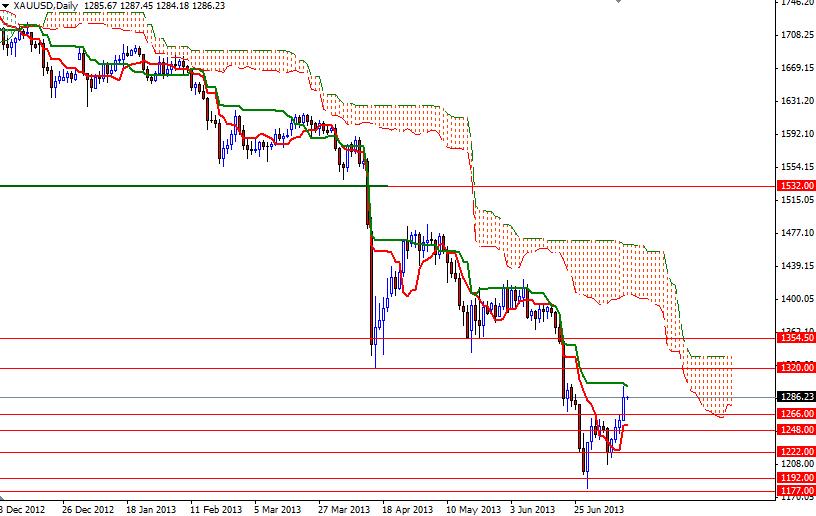
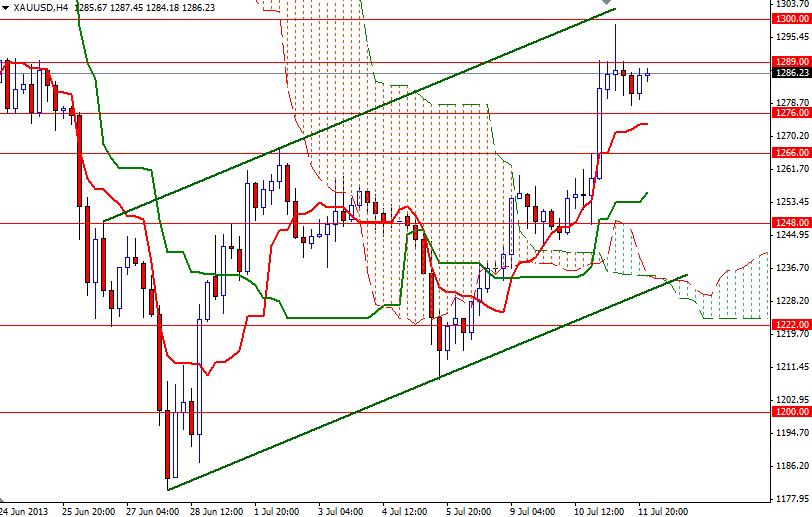
The American dollar continued to lose ground against gold during yesterday's session as the precious metal got a boost after the release of minutes from the Federal Reserve’s last meeting. According to the records, “Many members indicated that further improvement in the outlook for the labor market would be required before it would be appropriate to slow the pace of asset purchases”. The news made investors realize that trimming asset purchases is currently a distant dream. As a result, we have seen prices bouncing back to the 1300 zone during yesterday's session as expected. From a technical point of view, if the bulls break through the 1300 resistance level, it is entirely possible that we will see the pair challenging the April 16 low of 1321.52. However, the 4-hour chart shows that the bears are trying to defend the 1289 level at the moment. So this is the resistance level which day traders should pay attention before opening a long position. If the bulls run out gas and fail to penetrate this barrier, prices will probably pull back to 1266 (or even 1248). Although there is a good chance the pair will be following the ascending channel for some more time, I think the Ichimoku clouds (the daily chart) will be blocking the bulls’ way. In other words, until prices climb and hold above the cloud on the daily time frame, the long term trend will be favoring the bears.