By: Alan Edwards
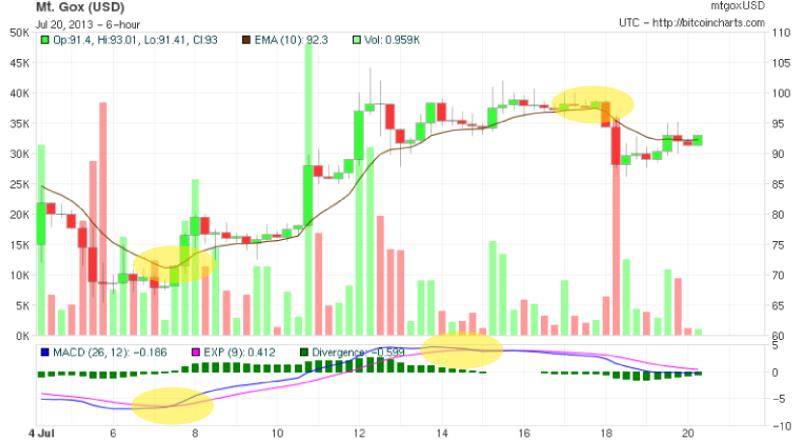
The outlook advice I gave on the 4 July 2013 “I would therefore suggest taking a small unleveraged punt once the momentum ticks for the experience of trading Bitoin but serious Bitcoin FOREX Trading on such an opportunity is still a while off”. The initial outlook period was a key US holiday occurring as the price was being tested at a key point of resistance. If you had traded the forecast as I suggested when momentum kicked in and closed on a reversal of momentum you would have had a 50% return over in just over a week (~2500% annualised).
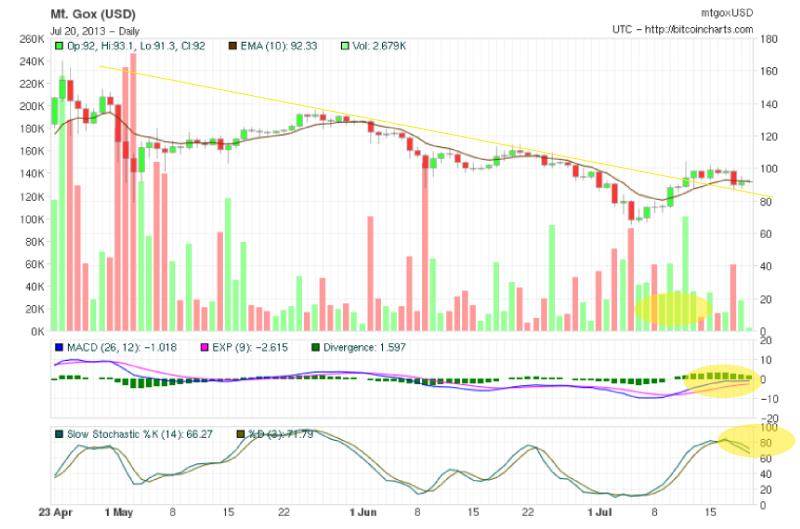
The long term chart shows three separate indicators showing different stages of momentum change against a background of a steady downward trend lasting a number of weeks. Personally I am always more cautious shorting when momentum indicators show the pair is overbought/sold when there are no obvious points of resistance. With the previous reversal having just occurred a long term floor of resistance I would not be making a trading decision of this chart.
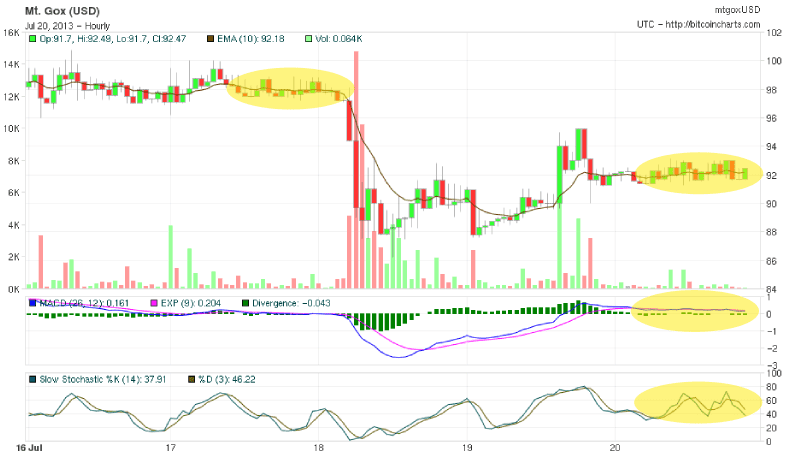
Looking back at today’s trading (20th) it’s clear a channel has formed which is also confirmed by the vey inconclusive momentum change indicator readings below. You can see the effect of the last channel breakout on the 18 July. You could trade the current breakout using a Bolinger or similar strategy with an exit strategy set for high volatility that will capture sudden end of a trend (I prefer a 3 period ema change of direction to exit a channel breakout). I recommend instead waiting until thee prices ranges 70-80 range for long and 90-100 range for short (or long for a breakthrough) supported by trade entry momentum indicators (always remember to factor in downwards and upward trends when trading momentum).
Alan Edwards is a financial engineer with 15 years experience working in the city of London. He is the founder and lead quant strategist of Spotz.com, a Bitcoin Risk financial services company specializing in security, risk management and investment.


