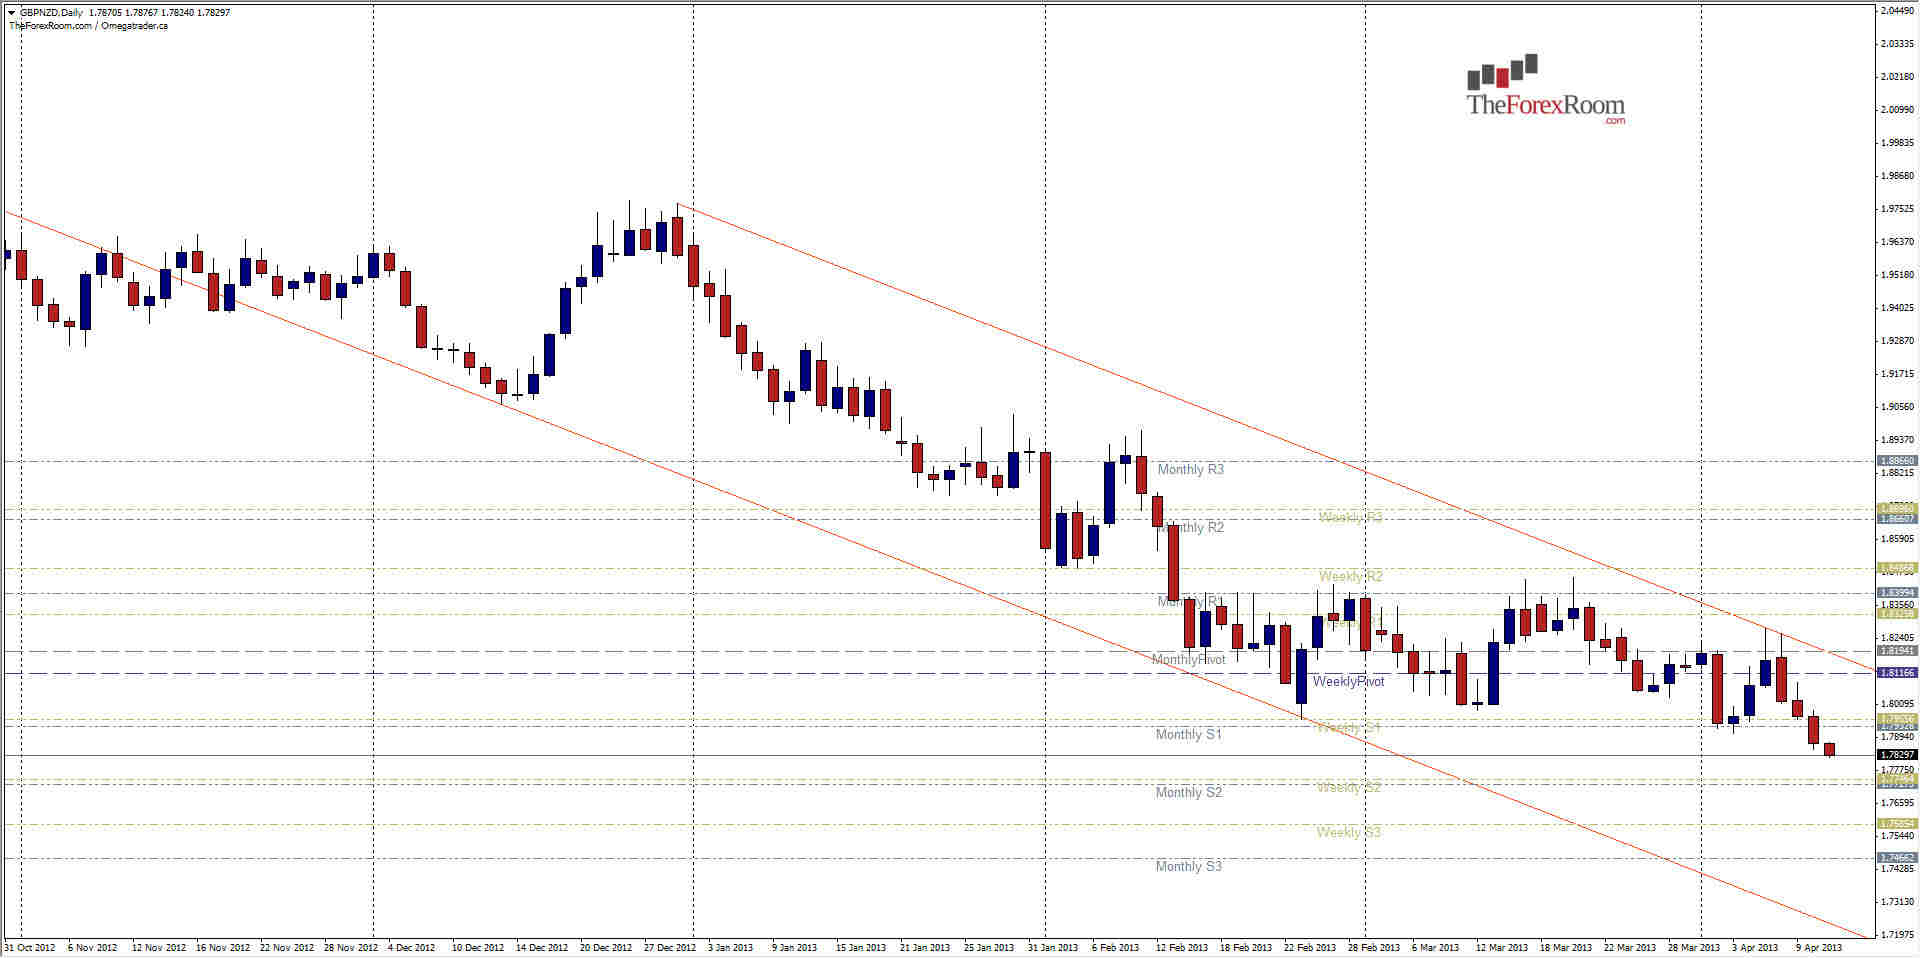
The Kiwi is at its strongest level ever against the British Pound. This comes as a result of a relatively constant and steady increase in value in the Kiwi Currency combined with a faltering Pound...and now takes us into completely uncharted territory just like Captain Kirk & Jean-Luc Picard. With no previously established support, where will it end? We can only look to projected levels such as Pivot Points and Fibonacci. The next major pivot point, according to my indicator at least, is the Weekly/Monthly S2 at roughly 1.7750. This also makes sense from a psychological aspect as any '50' level tends to be troublesome for some currency pairs. We can also use channels, which this pair is certainly in what could be called a descending channel, and using this criteria we might speculate that the pair will continue to fall to as low as 1.7200-1.7300 before finding the lower channel projection line. That said, we could print Pin Bar or a double/triple bottom at any point for an indication of a reversal or pull back. For example, at time of writing, the pair has printed a 4-hour inverse hangman pattern and could indicate a reversal as early as the next hour. A break above 1.7865 could confirm this, and see the pair pull back to the previous support/Daily Pivot at 1.7905 or Weekly S1/Daily R1 at 1.7955. While a pullback/reversal is most definitely looming, picking the reversal point or bottom now becomes almost a guessing game...and therefore very risky to trade until we do establish some form of bottom.
GBP/NZD At All Time Low April 11, 2013
By Colin Jessup
Colin Jessup is certified in both Securities & Technical Analysis from the Canadian Securities Institute, founder of Omegatrader Canada and a Live Trading Coach at TheTradingCanuck.com, a service that calls live trades to captures dozens of pips daily with low drawdown....
Read more Subscribe Sign up to get the latest market updates and free signals directly to your inbox. *By registering you agree to receive communications.
Please enter a valid email address

By Colin Jessup
Colin Jessup is certified in both Securities & Technical Analysis from the Canadian Securities Institute, founder of Omegatrader Canada and a Live Trading Coach at TheTradingCanuck.com, a service that calls live trades to captures dozens of pips daily with low drawdown.
- Labels
- GBP/NZD
