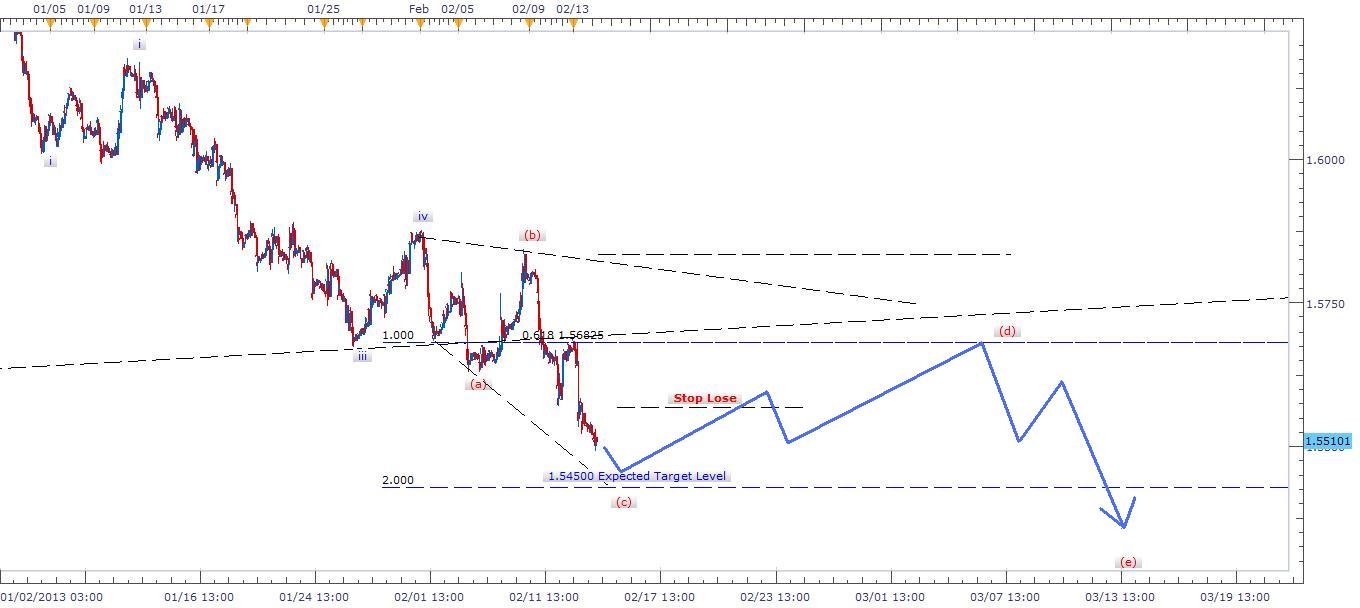
Currency: GBP/USD
Method: Elliott Waves
Description: A larger correction of a falling channel started on 10 November 2007 and contracting corrective triangle started on 1 August 2009 two years after the drop which it ends on 22 December 2012. However, I will be watching a larger drop for GBP/USD further for the coming few months and will follow Elliott waves patterns as posted. Expanding diagonal in final wave five where the trend is forming a ZigZag correction between points B and C where we have a small room left for today trade but i will save the biggest move when the price bounce back to point (d) as shown in blue arrow. I would suggest day traders to short and hold for today target at 1.54500 and the second trade on or around 1.56800 for the final wave toward (v) or (I) of complete cycle.
Recommendation: Sell and Hold
Stop Loss: 1.6500
Target:1.54500

