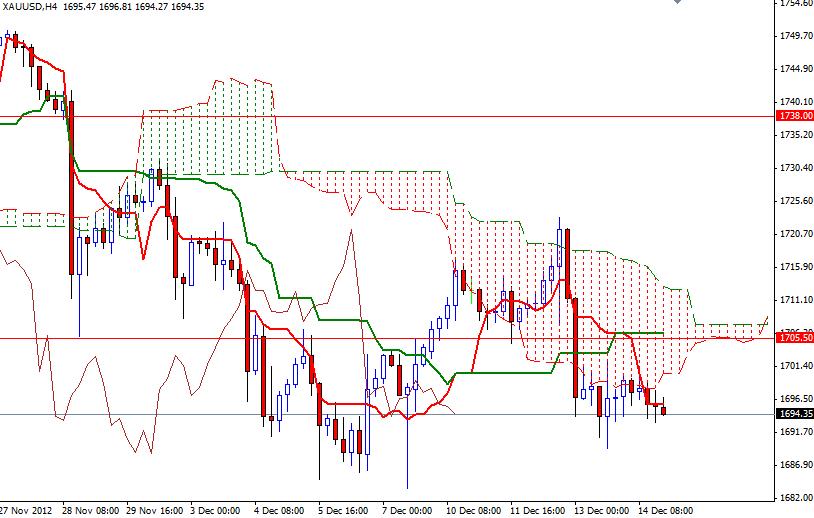
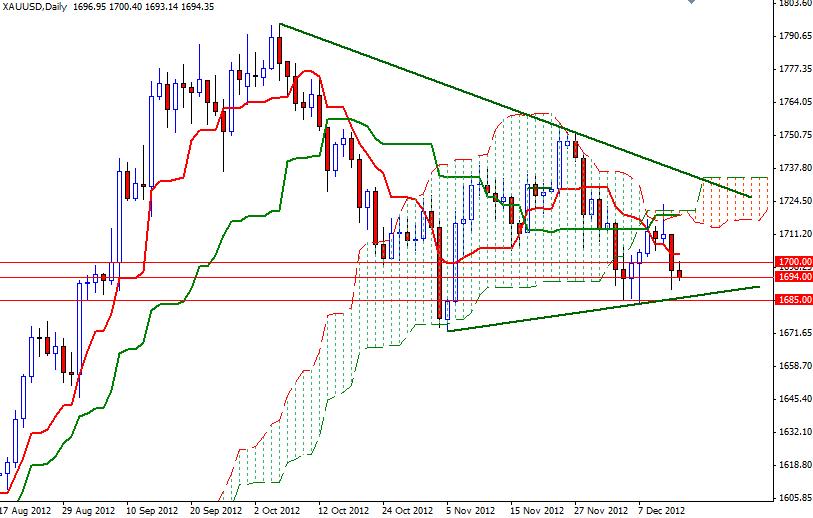
XAU/USD tried to break through the previous week’s high (1723) on Wednesday but ran out of steam as investors used this opportunity to take profit. This level has been a significant resistance/support level since October and as a result it became an ideal level to realize profits. I think XAU/USD shows signs of exhaustion since the Federal Open Market Committee announced that the Federal Reserve will expand monetary stimulus. It seems that most traders have been reluctant to take sizable positions; therefore the volume and strength behind the bulls were not enough to capture the battlefield. Although the major trend has been strongly bullish for the past 12 years, prices have been moving in a horizontal channel since September 2011. While the daily chart shows a possible triangle forming, the top of the triangle coincides with the Ichimoku cloud. This could make things miserable for the bulls as 1717-1734 zone turns into strong resistance. Both the daily and 4-hour charts are bearish.
Prices are below the cloud and the Tenkan-sen line (nine-period moving average, red line) crossed below the Kijun-sen line (twenty six-day moving average, green line). The XAU/USD pair closed the week just above a critical support level. Technically speaking, I think it is highly probable that prices will continue to fall unless the bulls push XAU/USD above the 1735 level, which is the upper line of the cloud on the daily chart.
Resistance to the upside may be found at 1700, 1705/07 and 1712.60. A daily close above 1716 could shift things to the bulls on the short time-frame. If the bears manage to pull the pair below the 1694 level, expect to see some support at 1689, 1685 and 1676.76.


