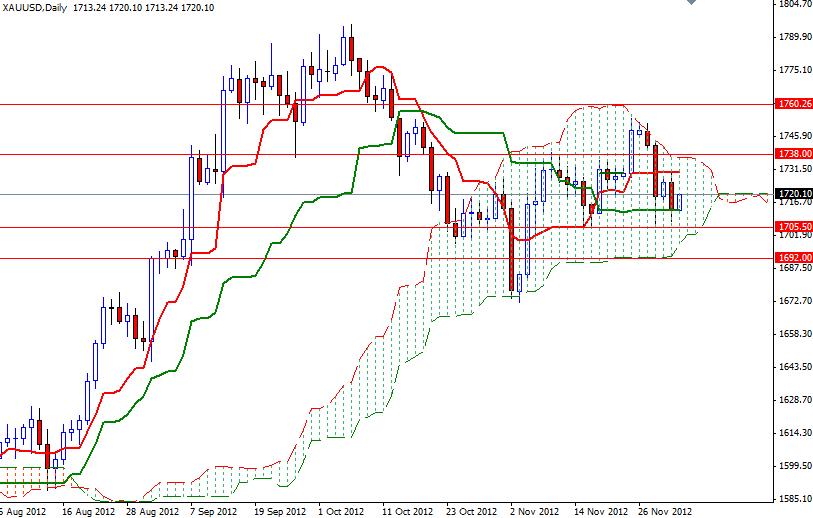
XAU/USD fell for the week but managed to close just above the Kijun Sen line (1713.38) at 1713.55. Prices drop after Moody's Investors Service has downgraded European Financial Stability Facility and European Stability Mechanism from Aaa to Aa1. Following the recent decline of gold price Friday, the precious metal bottomed out in the 1709 /13 area, before hitting the 1720 level during the Asian session today. Lately gold prices have been subject to volatility as U.S. political leaders were back to their old tricks of playing political games. The first week of the month is always a busy one for the central banks. This week also sees the usual release of PMI (Purchasing Managers’ Index) data from important economies around the world. However I believe that the gold market will continue to be driven by fiscal cliff negotiations and Fed’s money printing plans. I expect we will be trapped in the Ichimoku clouds for a few days more (i.e. the trading range will be between 1702.60 and 1736.57). At the moment, gold is giving us mixed signals from a technical point of view. The weekly chart is favoring the bulls but prices are still in the cloud on the daily time frame.
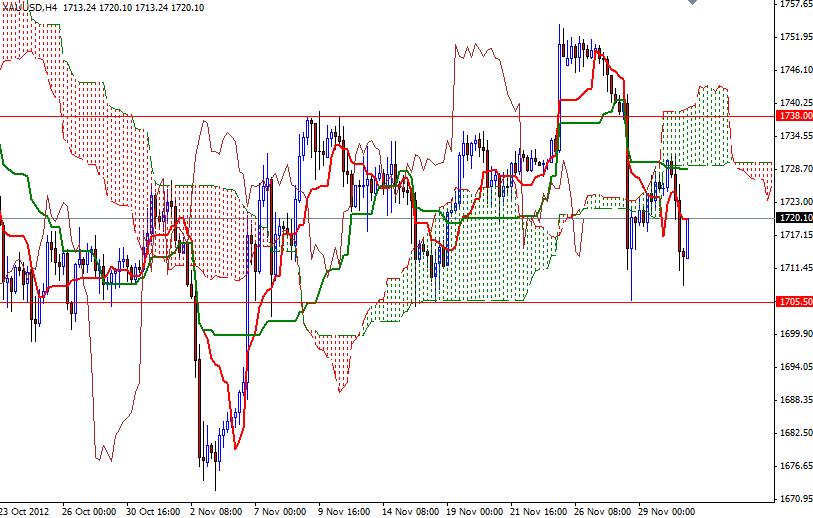
On 4 hour time frame, Tenkan-sen line (nine-period moving average, red line) is below the Kijun-sen line (twenty six-day moving average, green line), indicating the bears are trying to take over.
If the bulls can push the pair above the 1722 level, we could see a bullish run to the 1729 level while a drop below 1710 would suggest that the bullish run will have to wait a little longer and place control back in the paws of the bears. If that is the case, look for 1705.50, 1702.60 and 1692. Beyond the 1729 level, expect to see more resistance at 1734, 1738 and 1745.


