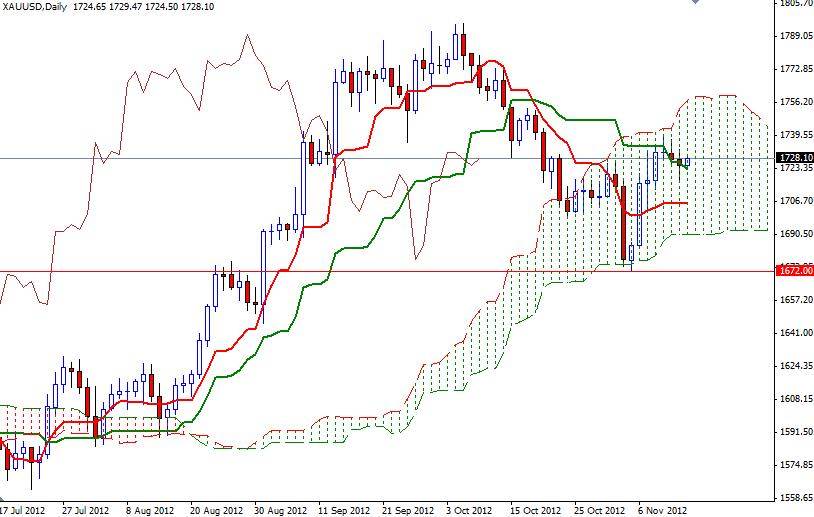
Gold vs. the U.S. dollar or XAU/USD has been bullish since the U.S. presidential election resulted in favor of Barack Obama. Gold investors have been focusing on the fact that the Federal Reserve will continue to print money as long as it takes and this will devaluate the American dollar. In addition, the fiscal cliff poses a major risk to the U.S. economy. Last week XAU/USD formed a key reversal pattern on the weekly chart as it bounced off of the 1672 level which was approximately the bottom of the Ichimoku cloud. Although the weekly chart is bullish, the pair is moving inside the cloud (daily chart), suggesting that the current trend is flat.
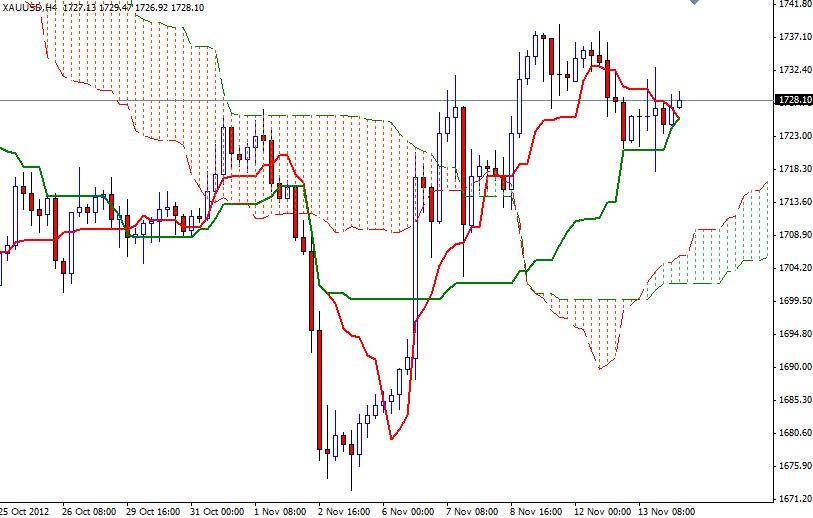
4 hour chart remains bullish as the Tenkan-sen line (nine-period moving average, red line) is above the Kijun-sen line (twenty six-day moving average, green line). I think this market as more of an upward bias over the long-term as long as we stay above the 1699 level. A break below 1699 would send XAU/USD back to the 1672 level.
Today, the key levels to watch will be 1731 and 1720. If the bulls manage to push the pair above 1731, look for 1736, 1739 and 1743. If the bears take over and increase the downward pressure, expect to see support at 1720, 1715.30 and 1712.50. US retail sales figures and the minutes from the last Federal Open Market Committee meeting may be the catalyst for a strong movement.


