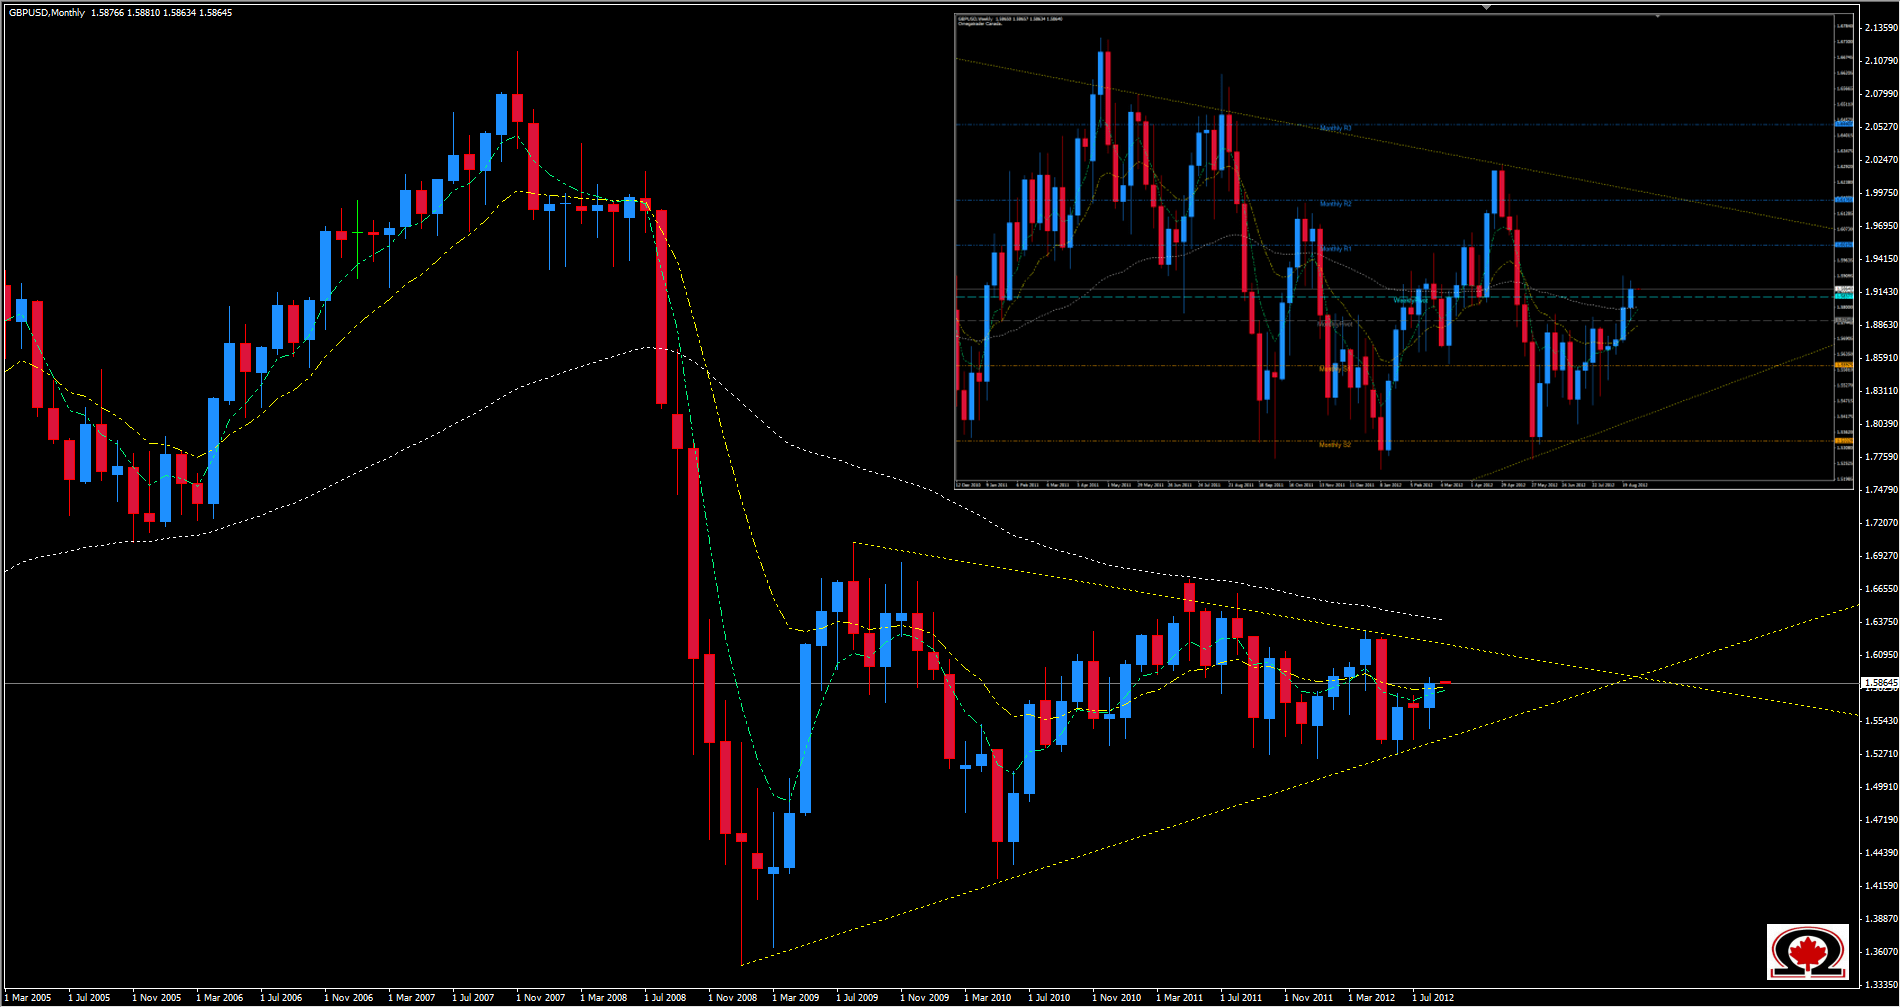
The GBP/USD closed the week above the 62 Week Moving Average again, maintaining its mildly bullish momentum for another week and re-entering the range between 1.5800 & 1.6000 that held it captive for several months in early 2012. I say mildly bullish because the pair is also trading in an ever tightening range which can be seen very clearly on the Monthly chart, similar to the Gold (XAU/USD) chart that we discussed awhile back. That pair has indeed made a break to the upside, and the GBP/USD appears to be heading in that direction as well. The Sterling has a long way to go before a long term Bullish breakout can be confirmed however as the upper trend line is at roughly the same level as the Monthly R1 of 1.6019. If the pair continues to respect this descending triangle otherwise known as a pennant formation, we should see price continue higher up to the 1.6000 area before turning Bearish once again and falling to test the ascending trend line that makes up the bottom of the range/pennant at roughly 1.5600, the same area as the Monthly S1. A break of last weeks high at 1.5895 could signal a bullish run to the 1.6000 level while a close back below 1.5800 would suggest that the bullish run will have to wait a little longer and place control back in the paws of the bears. Intraday Resistance can be seen at 1.5912 + 1.5962 while intra-day support sits at 1.5837 + 1.5795. The monthly Pivot is also strong support at 1.5754.

