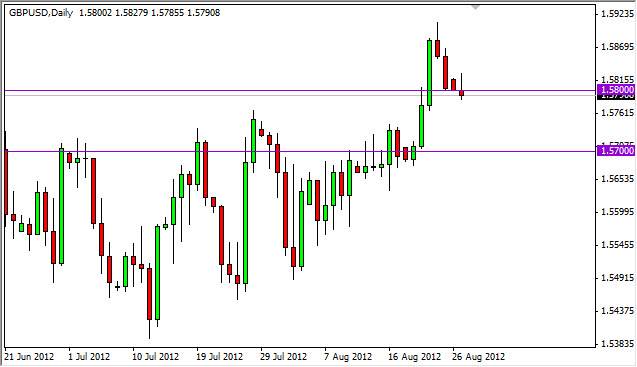
The GBP/USD pair had a relatively disheartening session on Monday for the buyers. We initially trying to break higher, but that surge was beat back as the sellers forced prices below the 1.58 handle.
The significance of the 1.58 area was that it signified a breakout of a larger ascending triangle that had been building up most of the summer. This looks like a clear-cut signal that we were going to the 1.63 area, and as such this would have been a fairly large move in the making. It should be stated that this signal hasn't been broken down yet, but this makes the next 100 pips probably the most important that this pair has seen in quite some time.
The fact that the Monday candle is a shooting star suggests to me that we are going to see lower prices. The real question then becomes whether or not we find support in the general vicinity below, in order to validate that breakout. I personally see support going all the way down to the 1.57 level, and as such am not too concerned yet but understand that a break below that area would in fact be very significant from the bearish side.
False breakout or simple pullback?
Charts like this offer a plethora of trading lessons. I see three potential trade signals setting up at once. The first one was the one that I alluded to at the beginning of this article. If we manage to break down on a daily close below the 1.57 level, I would see this as an extremely bearish signal and lower prices to be found in the future. I would be enthusiastically short of this currency pair at that point in time.
The second trade would be the classic "retest" of support as we broke out, pullback and then form some type of supportive candle. If I were to see something along the lines of a hammer or bullish engulfing candle between here and 1.57, I would be more than willing to go long and hold until we reach 1.63 or so.
The third possibility is that we break the top of the shooting star formed on Monday. This would skip the pullback that many traders would be waiting for, but a break of the top of the shooting star on Monday would signify that a certain amount of resistance has given way. That would be enough to get me long as well.
Charts like this require waiting until they tell you what they want to do. This is best achieved if you wait until a daily close. If any the conditions above are for filled by a daily close on this chart, I will follow the trade recommendations.

