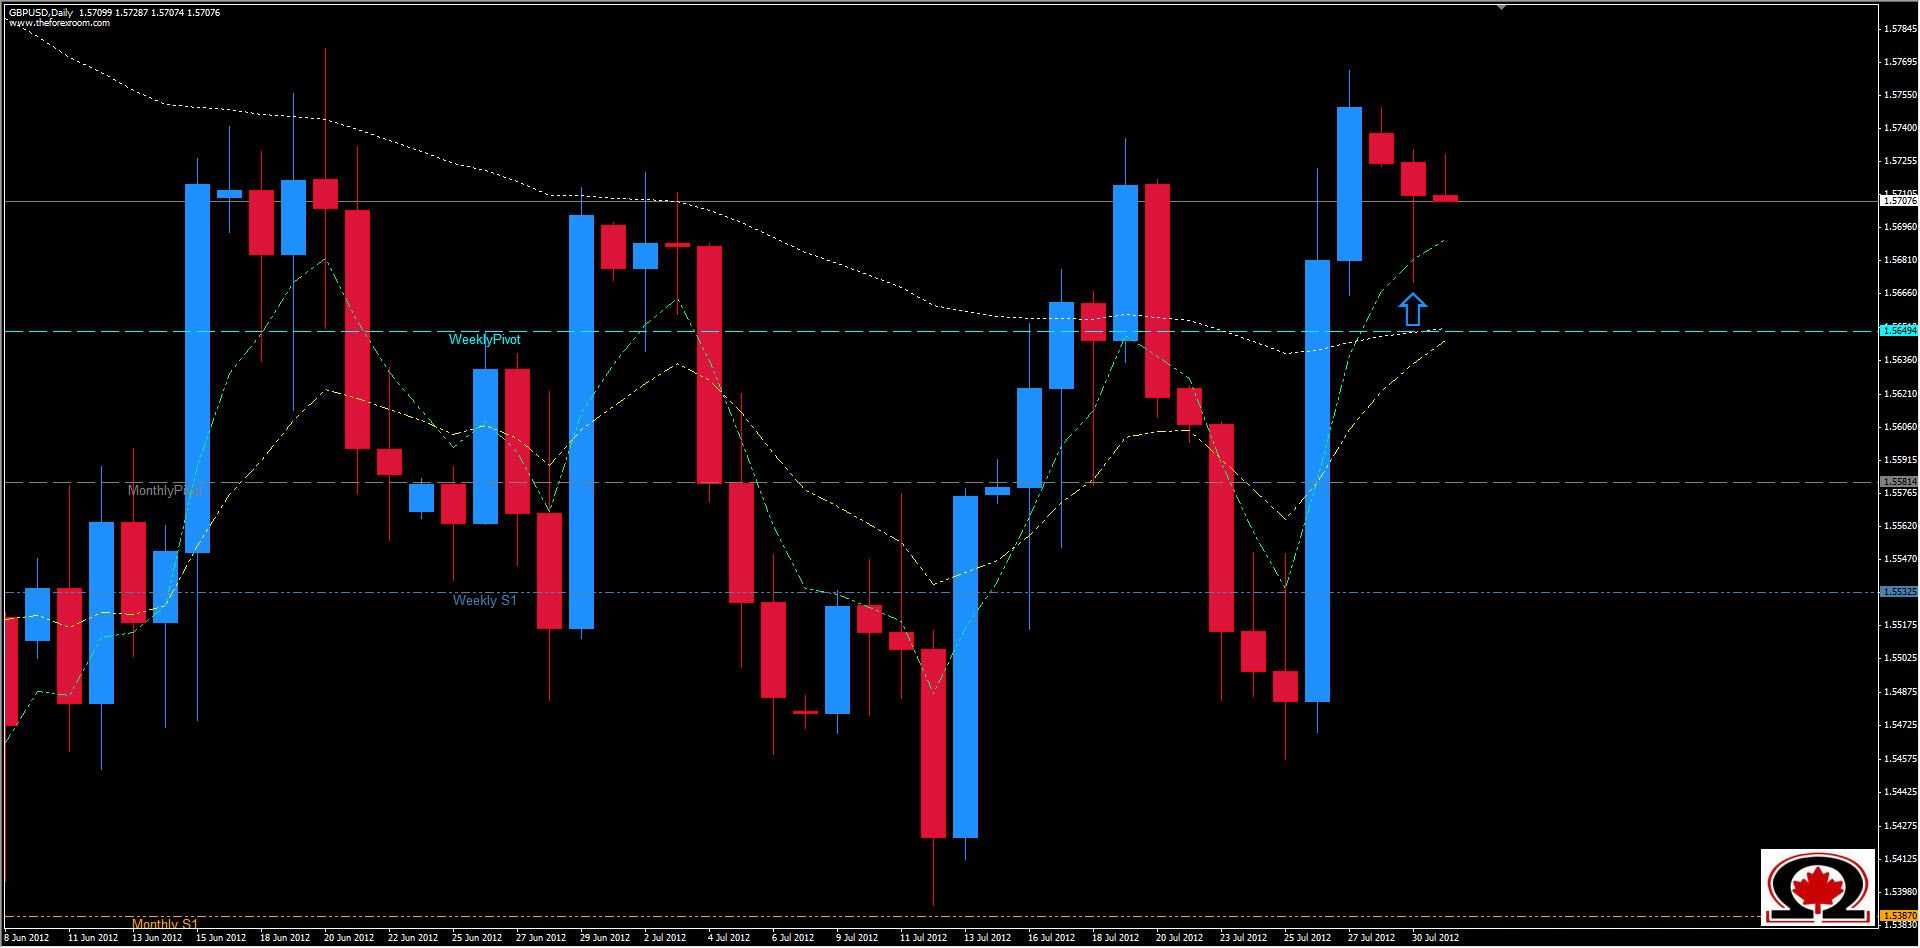
The GBP/USD took back roughly 267 pips from the USD last week, closing above the Weekly Pivot and 62 Day Moving Average. This is only the 2nd time since May 15 that price has closed on the positive side of the 62DMA in favor of the Sterling. The pair has been trading in a range below 1.5475 and above 1.5390 for the most part since the beginning of June and is prime for a break out but has been unable to break above the 50% retracement level of the Bearish move down from the years high at 1.6300, a level not seen since August 2011. Since hitting the 6 month low on June 1st of this year at 1.5267 the pair has struggled to gain any real momentum backed by the Bulls. Now the pair faces the challenge of resistance once again at the 1.5784 area once again, making this the 4 attempt since that 6 month low. Yesterday we saw price reverse slightly after last week's rally, but only to 1.5671 and intersecting with the 13 Day Moving Average but not closing below it. The 5 & 13 DMA's have crossed and spread apart indicating that higher prices are possible and the candle that printed yesterday, while Bearish, is usually considered a reversal or continuation candle depending on where it prints. This one printed on a strong support level at 1.5700 and seems to indicate a Bullish continuation. If the pair can clear resistance at 1.5784 & 1.5841 especially, there is an 200 +/- pip technical vacuum above just waiting to be filled by price action. On the way up there will be additional resistance at 1.5905 & 1.5958, but adding all of the factors together creates a strong argument for higher prices to come, regardless of additional resistance. To the downside, Support abounds as well. In addition to the Weekly Pivot at 1.5649, the Monthly Pivot is at 1.5581 as well as the Weekly S1 at 1.5532. I am cautiously Bullish on this pair.

