By: Christopher Lewis
While the public on the whole tends to only focus on oil prices in terms of how things are getting more expensive, the truth isn’t always so. Sure, you can go out into the streets and talk to people about it, but they generally have no real idea how the markets move. Also, there are a plethora of complexities to this market that will often confuse those that try to step into this arena, giving this market a bit more of a difficult reputation that it deserves to be quite frank.
The oil markets on the whole are very technical. There are various types of oil sold on the open markets, but they all tend to behave in a similar fashion. While divergence is possible, especially if there is a specific regional problem, the truth is that over time they all move in the same direction and this is fundamentally determined by supply and demand.
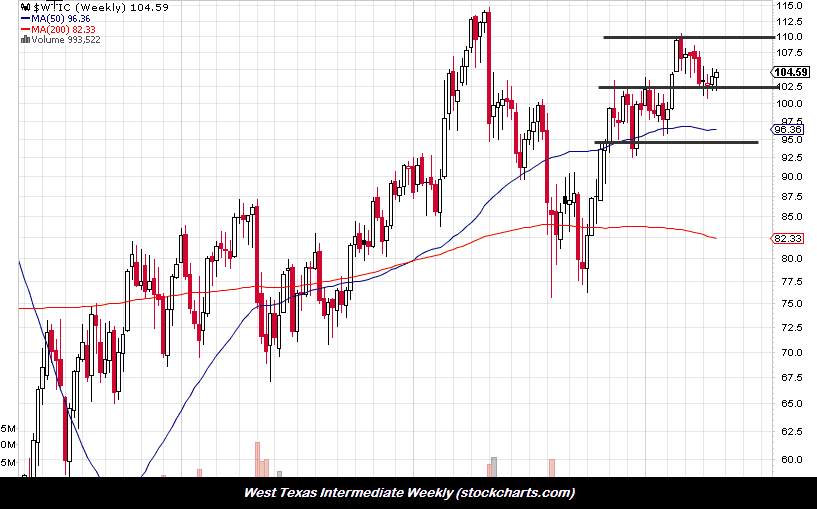
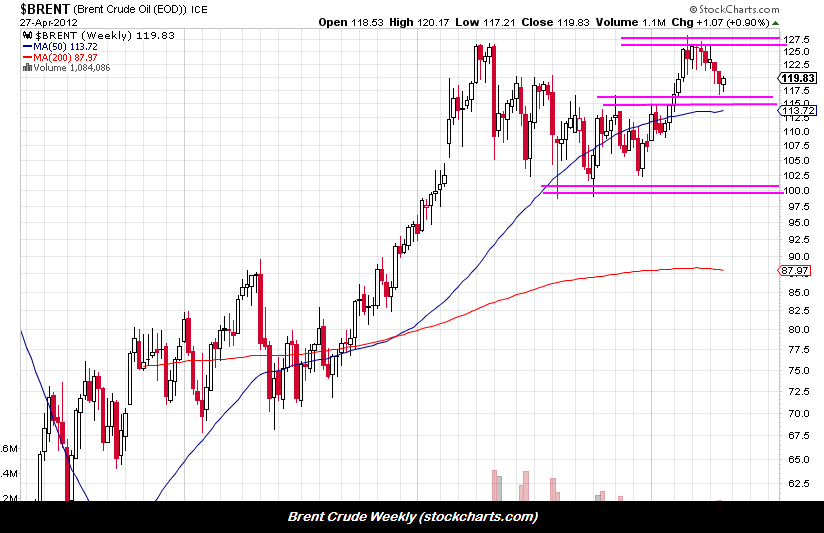
When looking at charts of the various markets, you will notice something if you are able to step out far enough. As you zoom out, the oil markets suddenly look very orderly. For example, the $5 and $10 intervals seem to almost always be the support and resistance levels that price will respect. Granted, there are events from time to time that will make the markets ignore them, but over time these levels tends to cause reactions. (Obviously, in times of natural disasters and war markets can enter panic mode…)
Looking at the charts currently, they show these levels very clearly. However, there is one quirk when it comes to West Texas Intermediate (WTI) in the form of the $102 level. Having said this, the support level at that price is actually a thicker “zone” that runs down to $100. You can see this happen when the markets are looking at a major psychological level.

Another thing you will notice about the attached weekly charts is that they are very symmetrical. There are obvious support and resistance areas at the moment, and the markets simply look “stuck”. This lends itself to a sideways summer, and this makes a bit of sense if you think about it as the economic forces that influence oil prices are so conflicting.

The situation with the Iranians and their nuclear program isn’t going away. The last time the Iranians and the West talked, they essentially agreed to keep talking. This has put a bit of calm in the markets, but there will also be a lot of skepticism as well, considering that the situation has played out over and over. This is a positive for prices overall, as at any moment a few choices words would cause a spike in prices.
The demand for crude is shrinking in the industrialized world. Europe has several nations entering recession at one time, and the United States has only weak growth at best. The lack of demand is a negative to prices, and the once positive emerging markets are showing signs of slowing down a bit as well. This will be negative for oil prices overall.
Adding to the mix, the Federal Reserve hasn’t taken the idea of quantitative easing three off of the table either. This can work both ways for pricing actually. The usual reaction would be for the Dollar to fall, and therefore things priced in it to rise such as oil. However, since we have seen so much easing worldwide, traders could see it as a bad sign on global growth. Because of this, the idea of further easing could be a very neutral subject. Only time will tell.
When thinking about these things, it isn’t that hard to see why oil traders would be confused at best. Also, there is seasonality when it comes to oil consumption by US drivers. Often, they will use more gasoline during the summer months. However, with all of these factors pushing and pulling back and forth, the immediate action in this market looks tight and choppy, but with a slightly upward bias, as seen on these charts.
