By: Colin Jessup
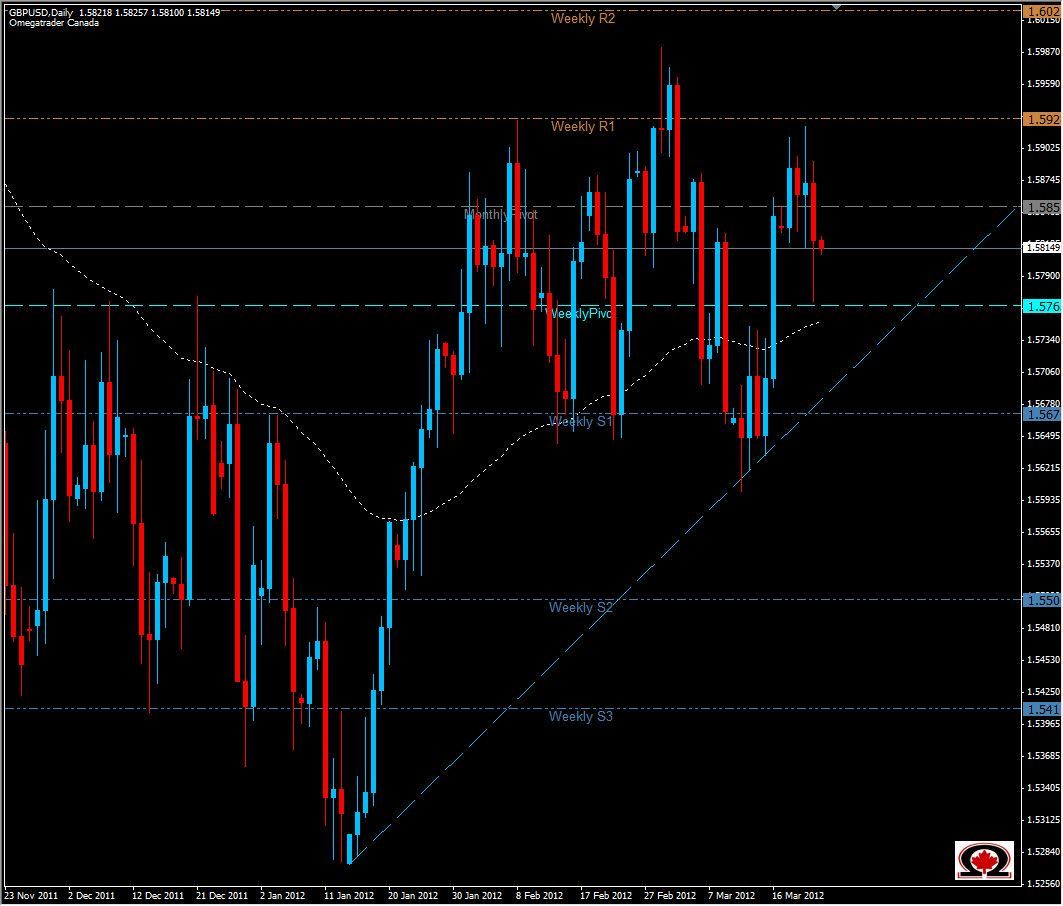
The GBP/USD tested the Weekly Pivot once more in yesterday's trading and appears to be forming a classic Head & Shoulders chart pattern on the Daily chart. Price action has been slightly more bullish than bearish during Aussie and Tokyo trading sessions, forming a bearish flag on the 1 hour chart and a total range of only about 45 pips since the New York closing bell. Price is has worked its way up to the Daily Pivot at 1.5820 and is currently trading at 1.5817 just above the 4-Hour Moving Average at 1.5805. I expect this pair will likely break lower after the London trading bell rings, retesting the Weekly Pivot and filling the 50 pip wick that today's daily candle is displaying. With 1.5850 being a strong Monthly S/R Zone, and the Weekly Pivot/Daily S1 lining up at the same 1.5760 level trading could be somewhat range-bound today, but overall there is indication that this pair could trade higher in the days ahead after possibly pulling back to roughly 1.5700, where a Trend-Line is also providing support. If price closes below 1.5760, expect the 1.5700 level to be tested, but if we hold above 1.5820 expect to test the 1.5880 level. While the pair has been trading in a range of about 300 pips for most of February and March, and offers some nice intra-day trading opportunities I am torn between slightly Bearish and Neutral until we close above 1.5920 or below 1.5670.

