By: Doug Rosen
In my analysis for the Swissy I was bullish, so naturally for the EUR/USD I am bearish. Of course, for this pair to fall down it will have to rise a bit more.

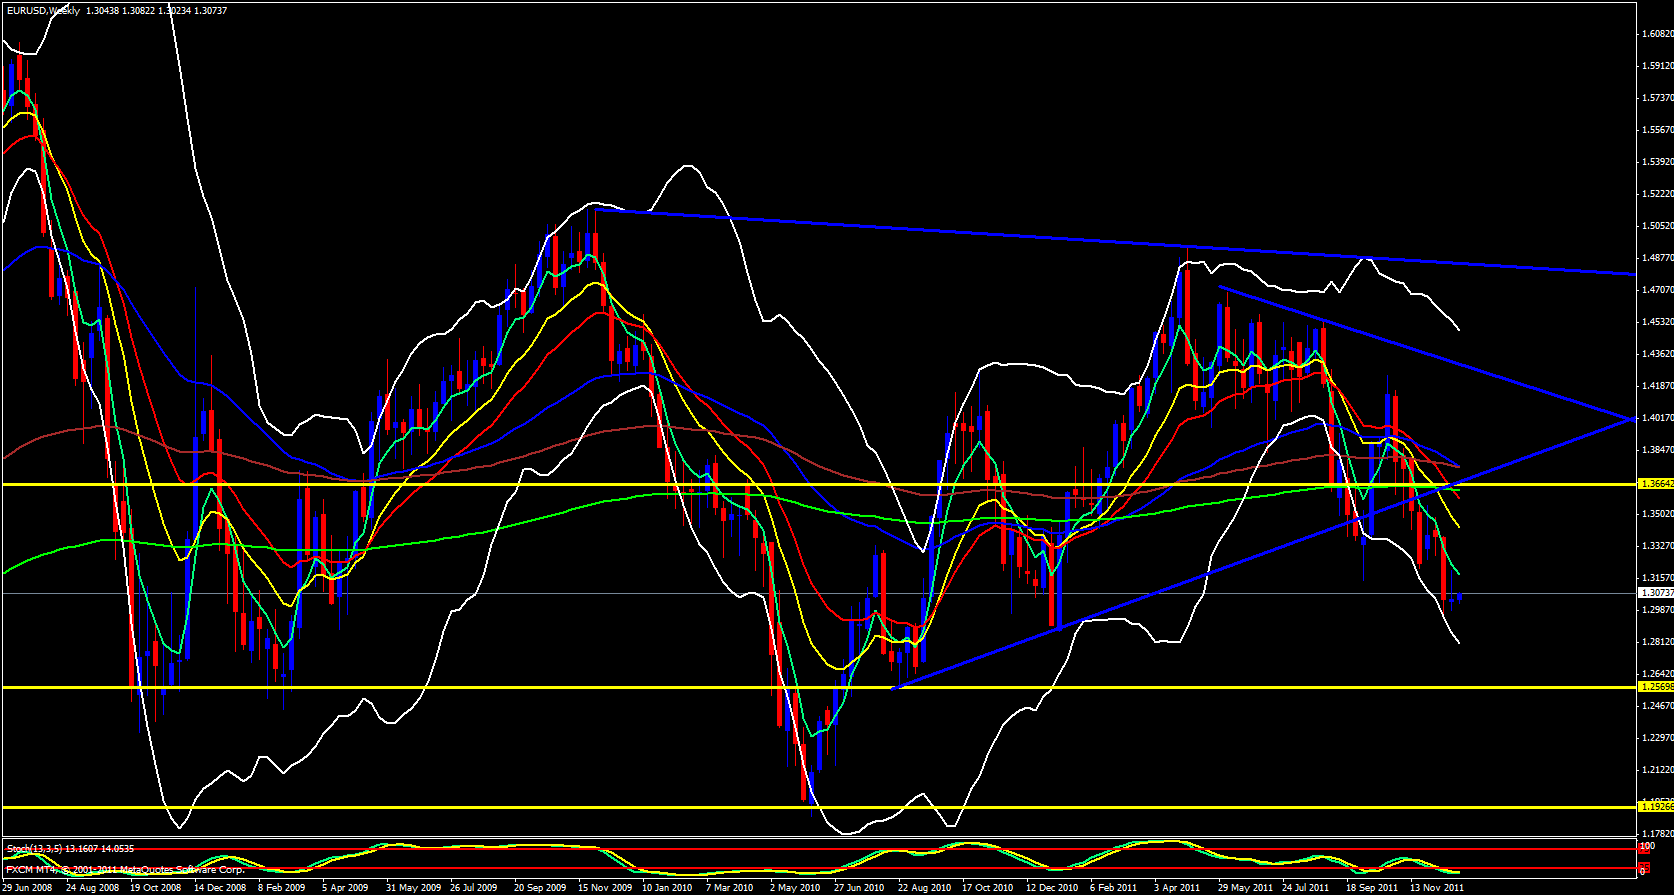
On the weekly timeframe the new weekly candle will need to climb its way up to the 5 ema to pick up the energy it will need to head downward. The weekly 5 ema exists at 1.3177 and moving on to the daily timeframe the 21 ema which happens to be overlapped with the 38.2 fib of the previous swing down is at 1.3176 so this is the area in which I expect price to start making its fall to the downside. I would also like to note that this level has been holding as resistance as of recently and has been support in the past as well.

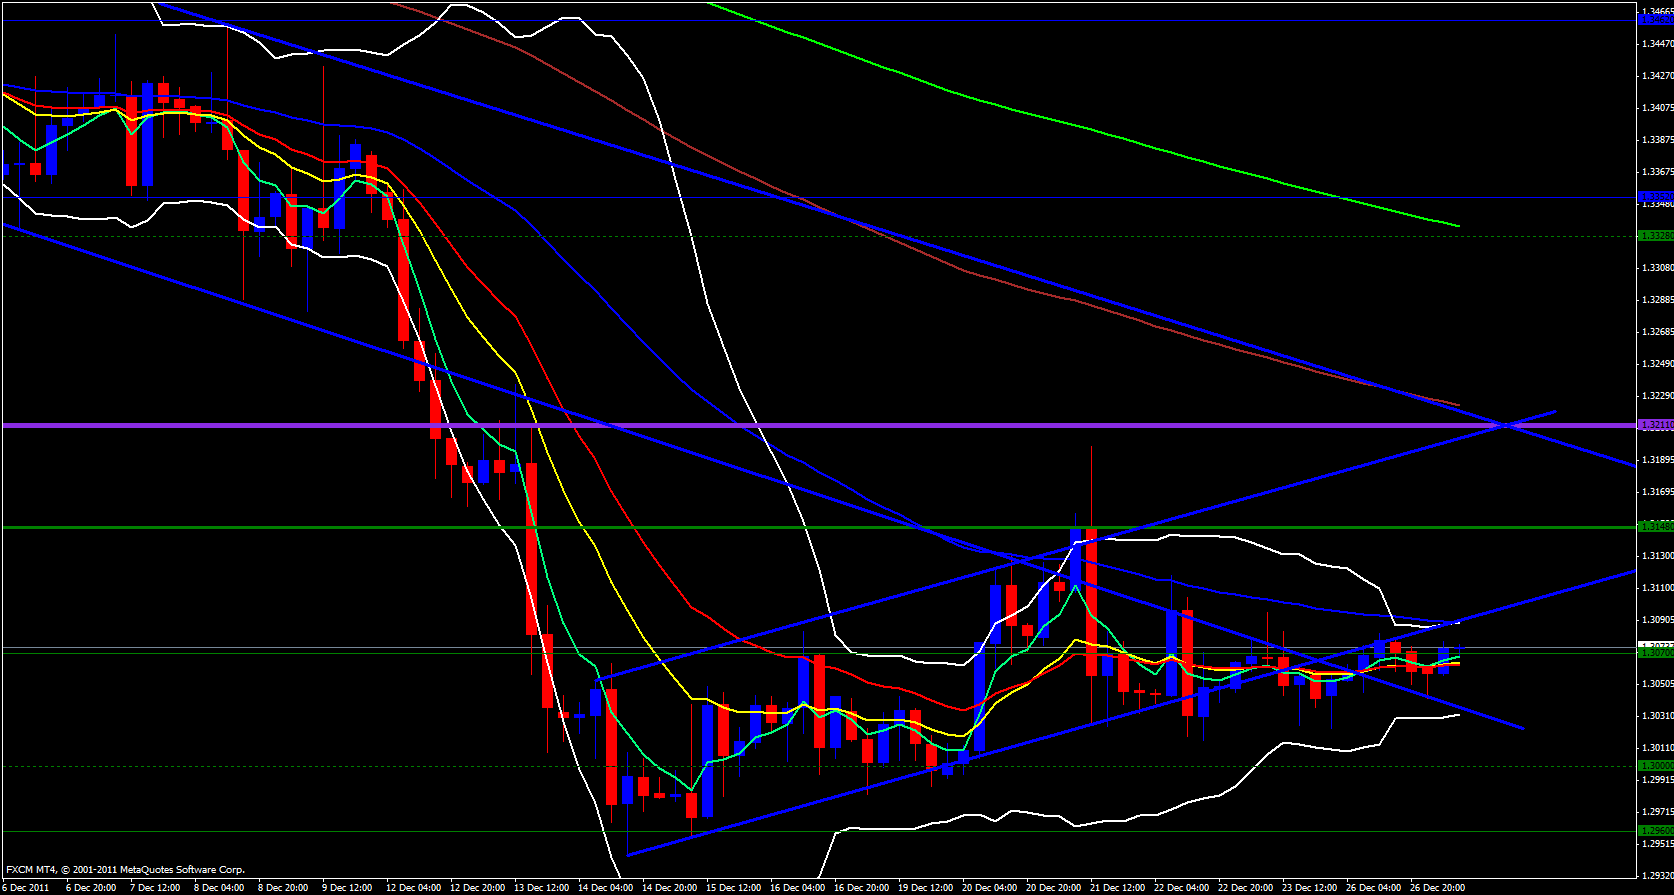
Moving on to the 4 hour timeframe I have price confined in a triangle price trap. The upper line of the upper trend line is at 1.3156 so it would seem very realistic to me that price will rise to that level and as high as 1.3176 ads I just mentioned then begin heading back down. The 4 hour 55 ema is sitting at 1.3090 which just happens to overlap with the upper Bollinger band and is the lower trend line of a price channel price had been previously confined within. This of course may very well be the area this pair will begin to fall again and as I have said already I am very bearish on this pair as I am bullish in its exact reciprocal pair the Swissy, but I also said that this pair will need to rise to the weekly 5 ema to continue its way to the downside and I do have a trend line 1.3170 so I would feel much better about taking my shot on EUR/USD if price will rise to 1.3170.

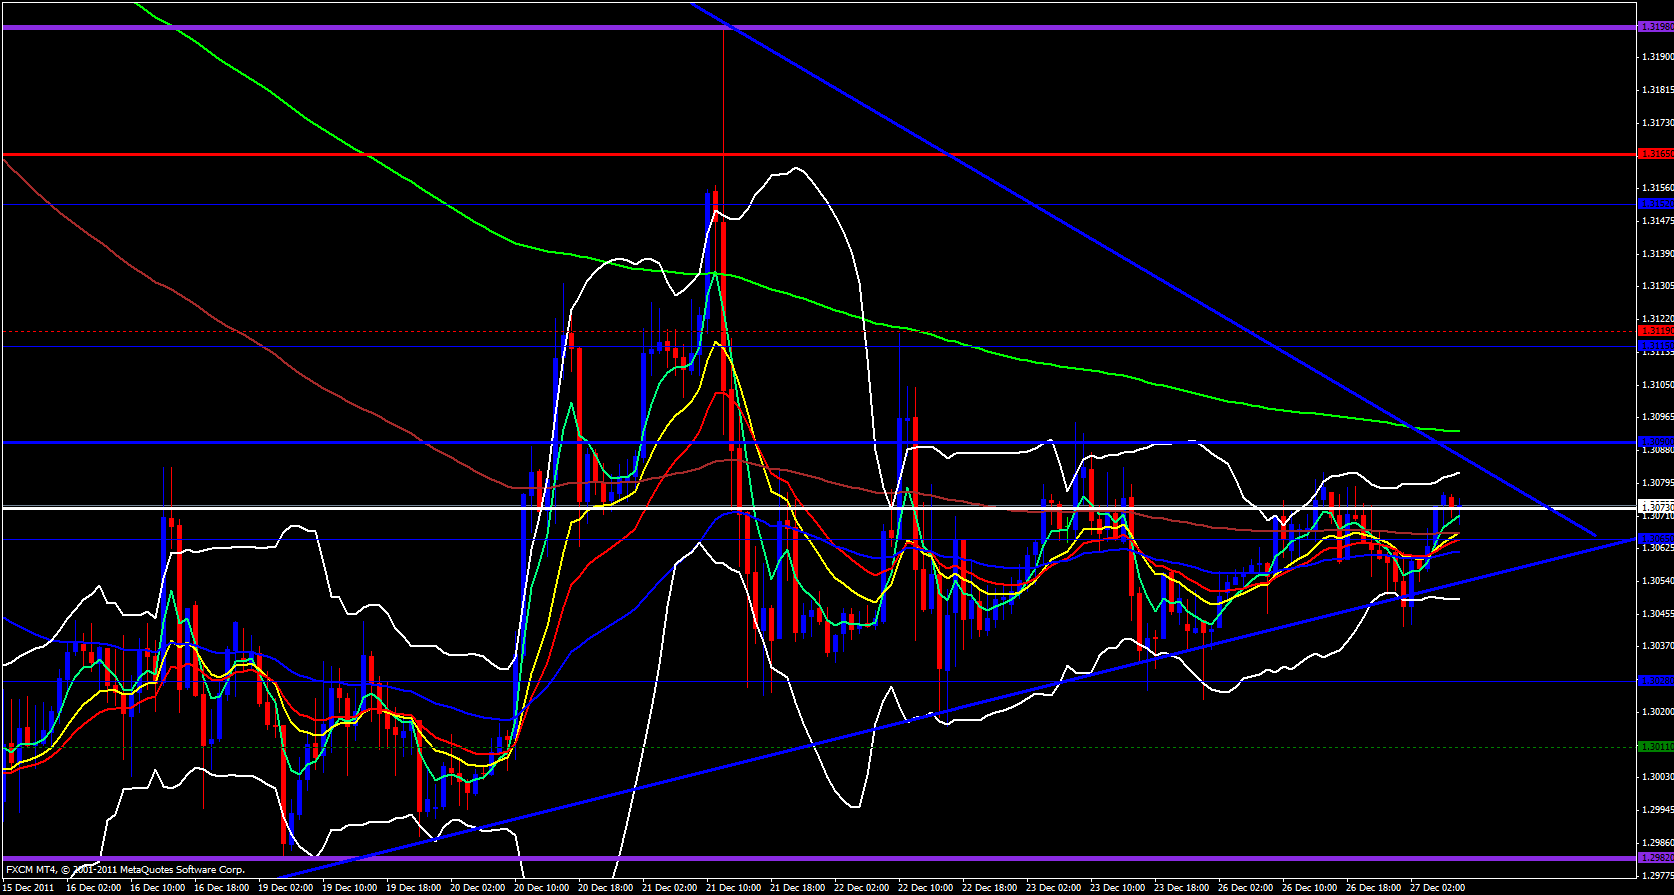
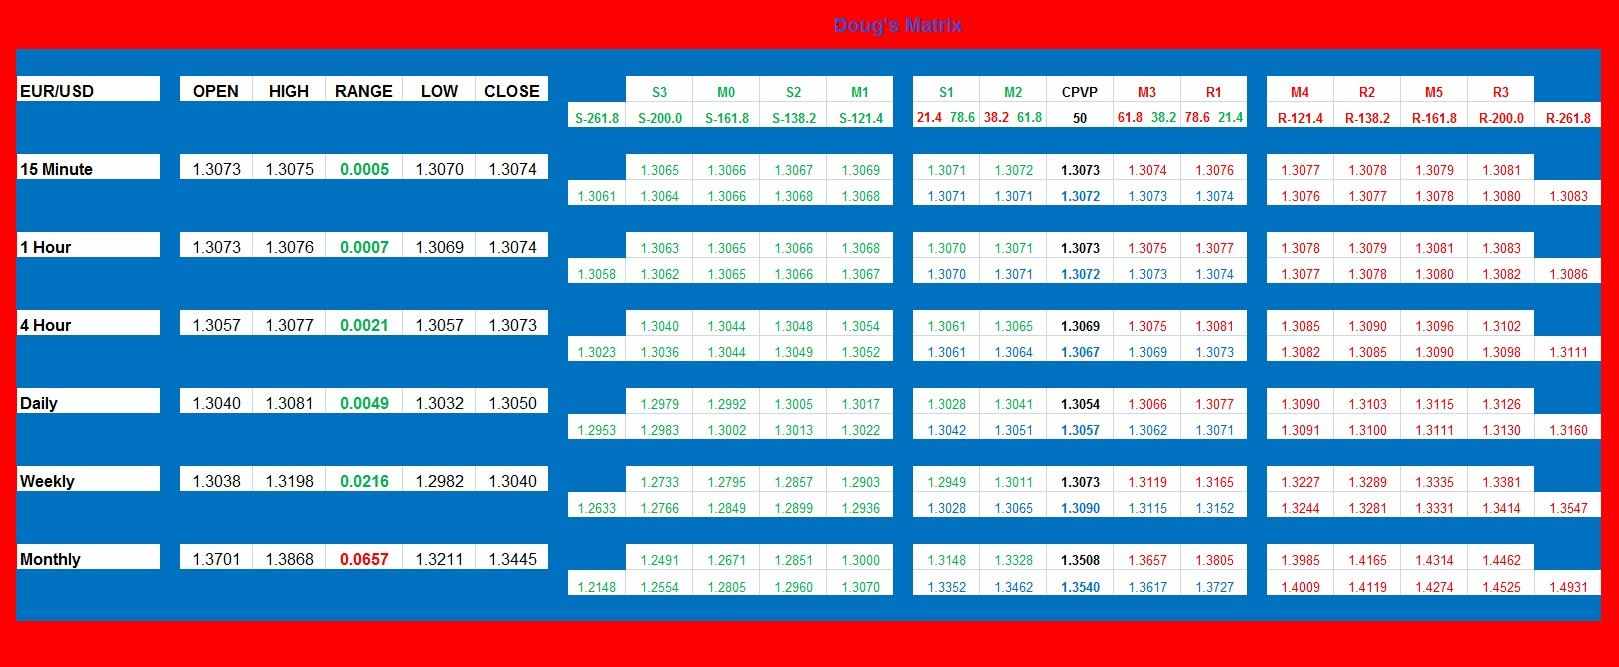
Moving on to the hourly timeframe I see that the hourly 233 ema is at 1.3093 which also happens to overlap with the 50.0 fib of last week's range and it also happens to be the upper trend line of a triangle price trap so this will also be an area to watch out for. This may very well be the area that sends price back down and if price reaches that area price may very well be vulnerable to a double top that can send price down so be strategic if considering a short at that level. Also be cautious if longing your way up just to short your way back down. The daily R1 pivot is just above current price action at 1.3077 and the daily M4 which is a reversal pivot is at 1.3090 and is shadowed by the 121.4 fib extension of yesterdays range (see Doug's Matrix) so this may very well be the area where price starts to continue its way back down which is where I said the 4 hour 55 ema is so watch that area very carefully. You don't want to miss any opportunities to grab a short.

Doug’s Matrix is a table I designed that displays every pivot point from the monthly all the way down to the 15 minute, however, by the time you view it the 15 minute and hourly data will already be expired but I do recommend keeping an eye on all the other levels. In addition to the Pivot Point levels I have provided the Fib retracements and extensions of the previous candles also over the monthly to 15 minute timeframes but the same thing applies, pay attention mostly to the monthly to the 4 hour since the hourly and 15 minute will be expired. The 4 hour pivot and fib levels are good until 10:00 AM GMT.
