By: Doug Rosen
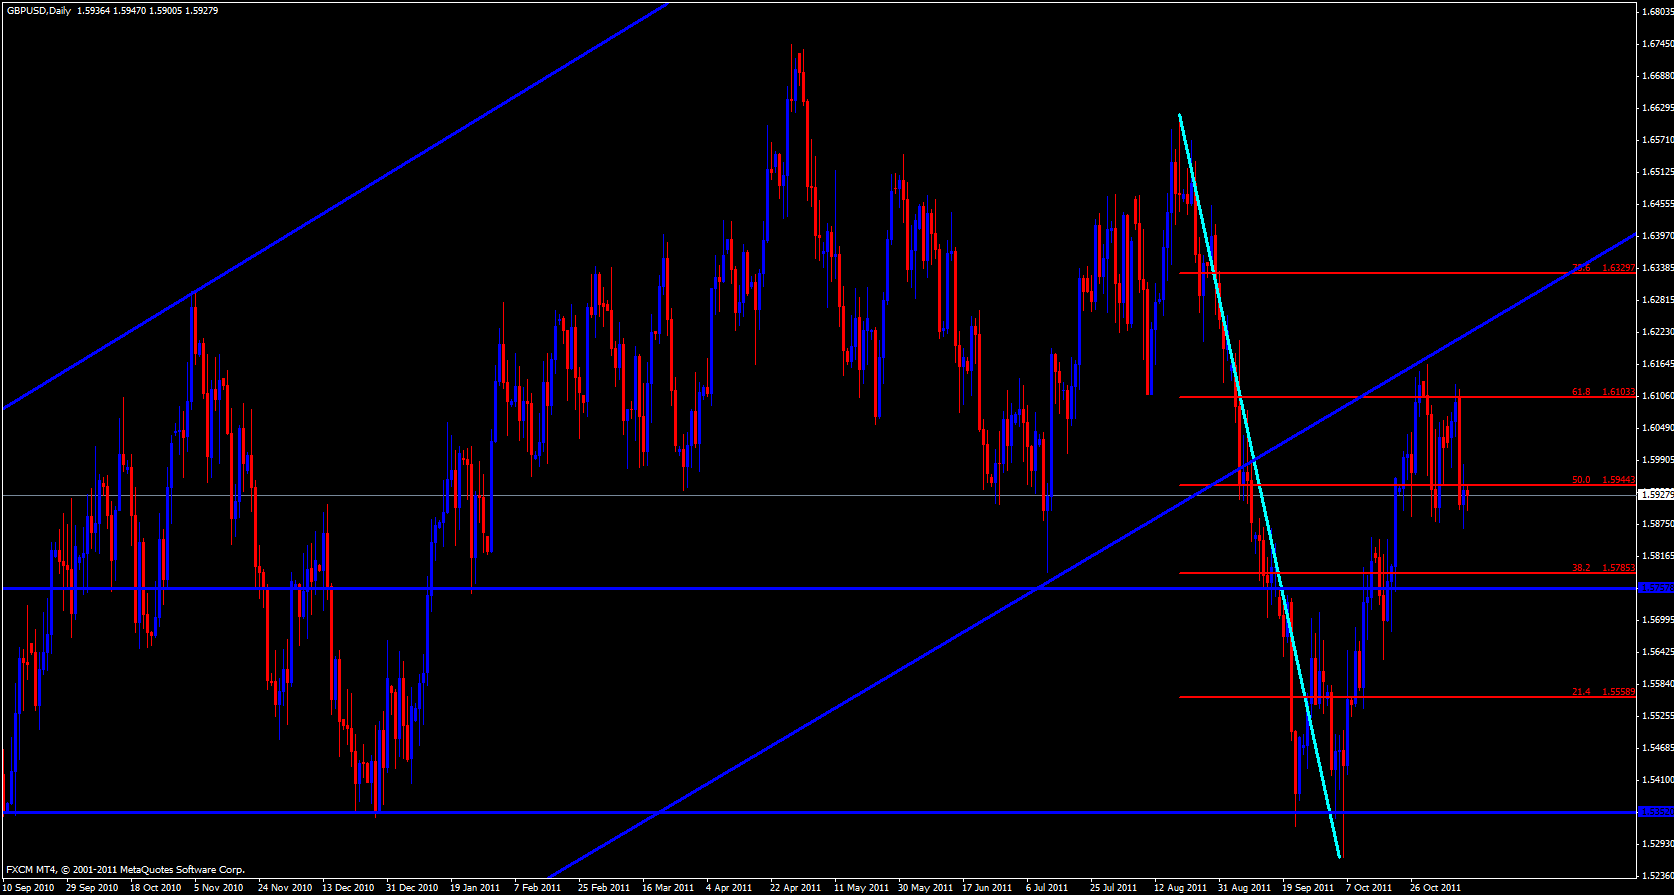
I begin my analysis for GBP/USD pair with the daily timeframe which in just a bit of a range. Price has been ping ponging between the 61.8 and 50.0 fib of the recent move down. Price is bouncing off the 55 ema and the lower Bollinger band is pointing up.
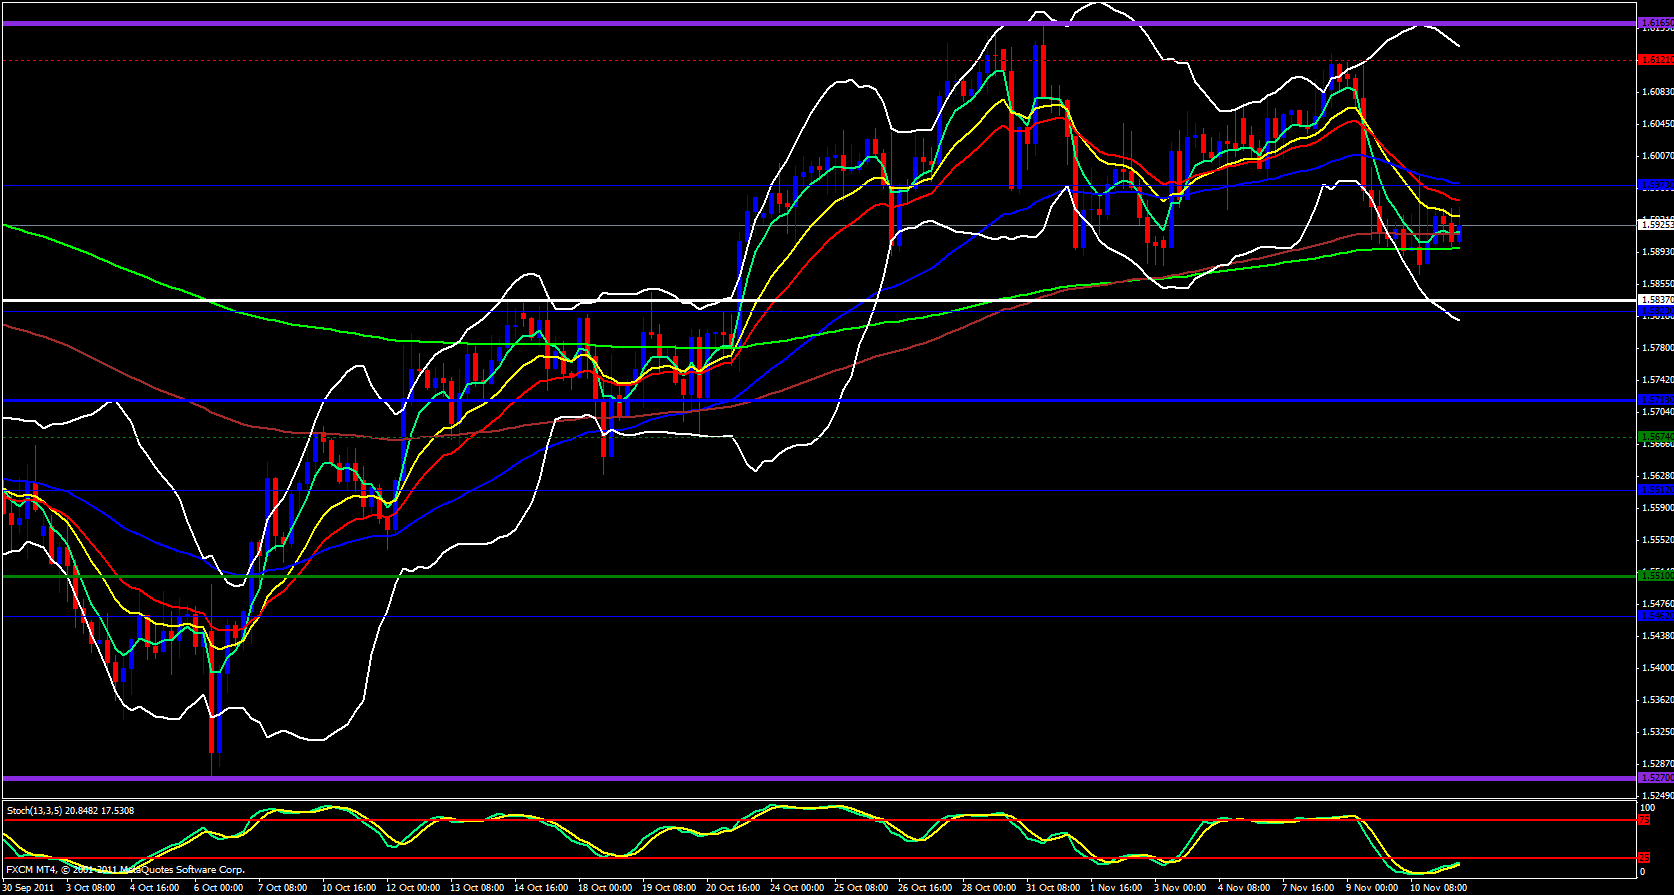
Moving on to the 4 hour chart Price has bounced off the 233 ema and the 5 ema is beginning to roll upward and the stochastics is in the oversold region crossing up.
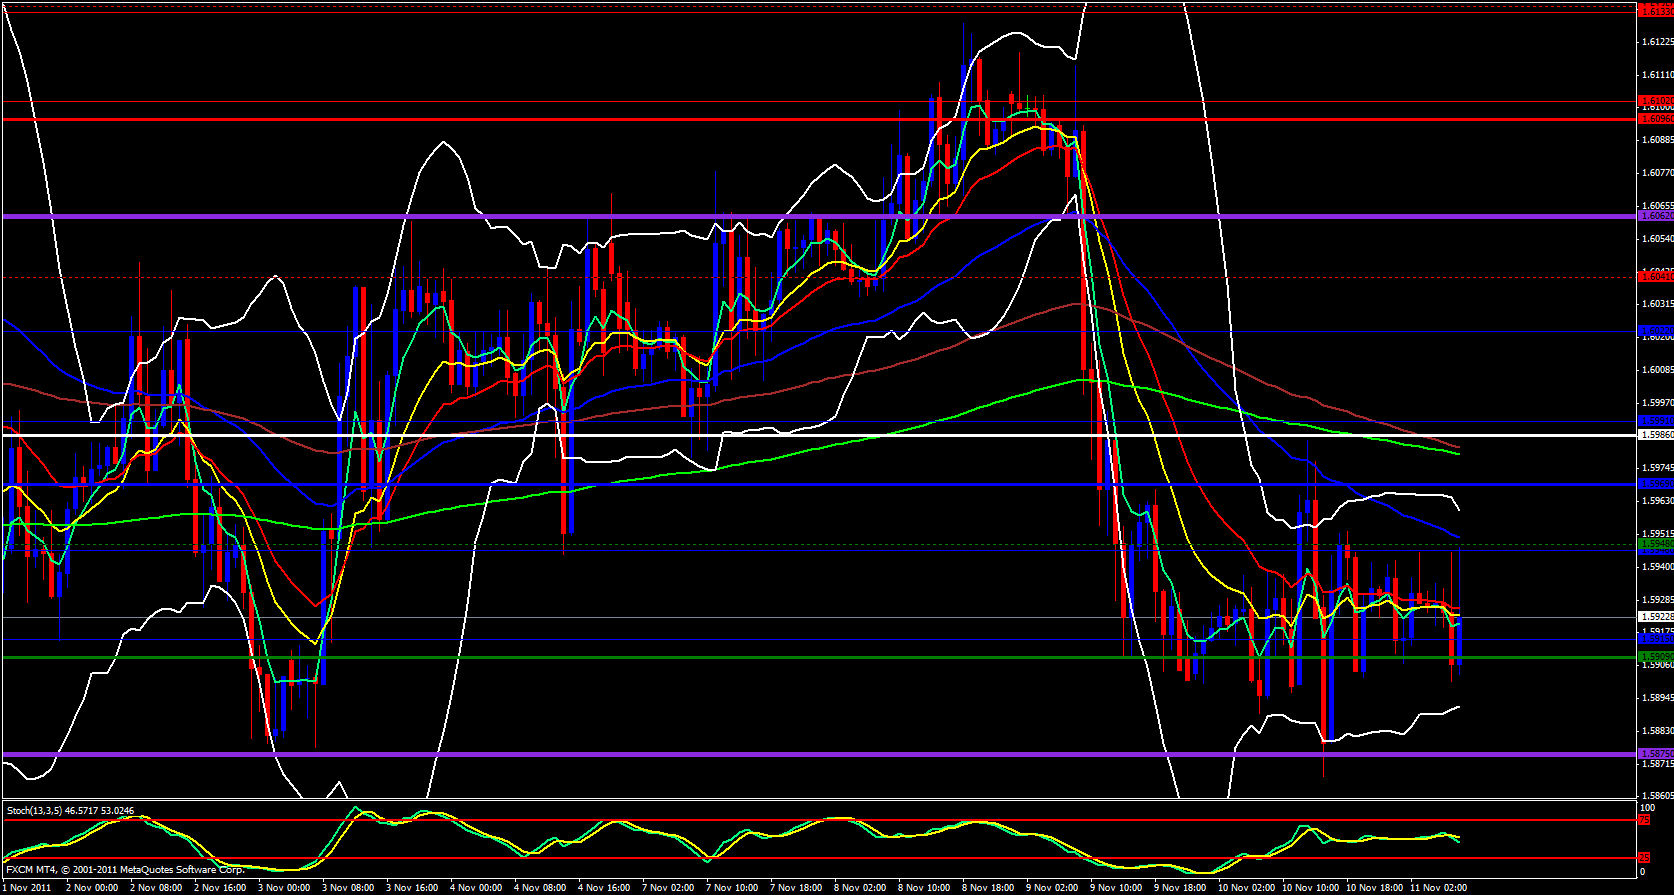
Moving on to the hourly chart price is in a range and just below lots of resistance and getting pushed down off the hourly 55 ema overlapped with the weekly M2 snd bouncing off the weekly S1 pivot.
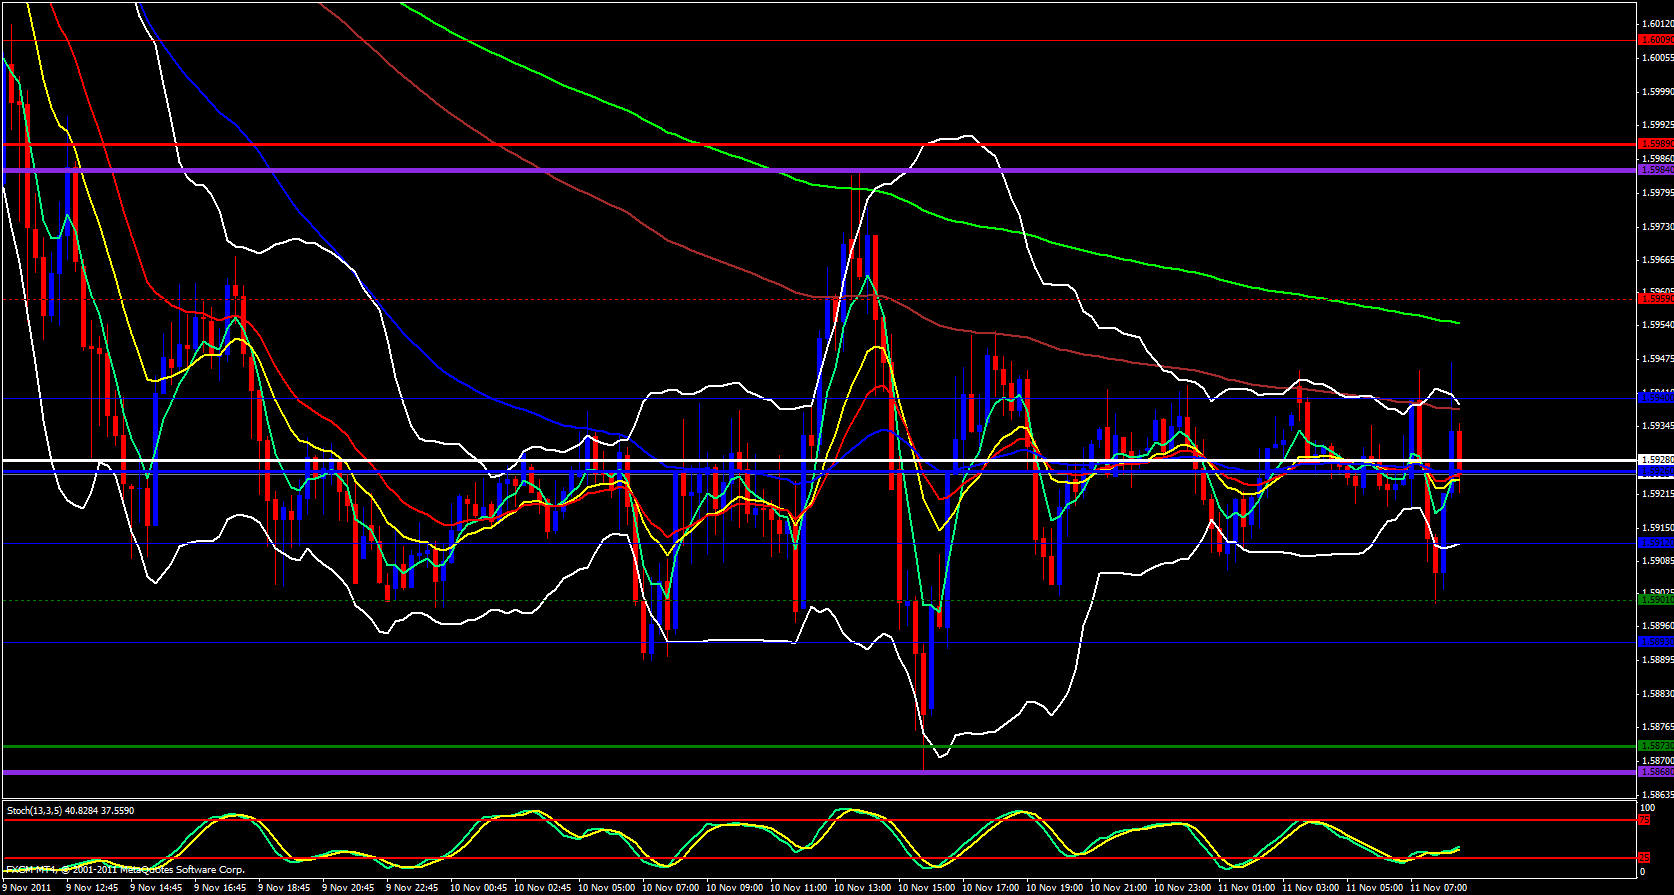
Finally, on the 15 minute chart the range is very noticeable but price is just above the daily central pivot point and the stochastics is pointing up but price must break the 144 ema that stands in the way before price can take off to the upside.


