By: Doug Rosen
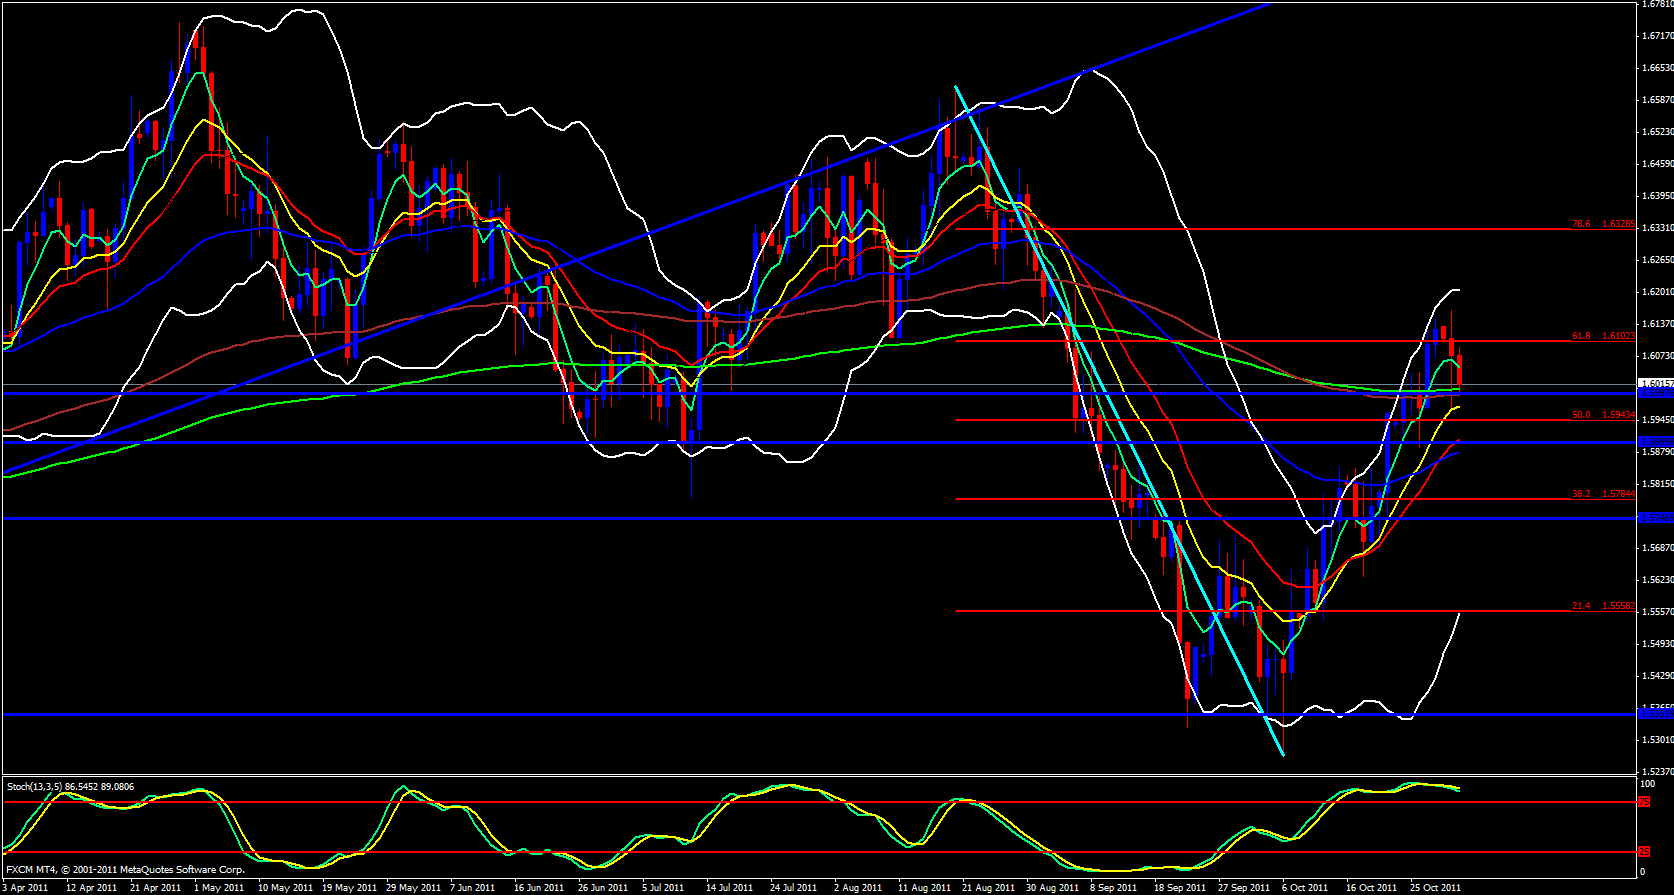
I will start out briefly with the weekly chart. Price is beginning to ride the 5 ema and the stochastics is pointing up. Moving on to the daily chart price has retraced down to the 233 & 144 ema which may act as strong support, however, the stochastic is in the overbought zone. We are kind of in a fib war. We are at a zone between the 50.0 and 61.8 fib level of the recent move down but at a fib of the last swing up. If something were to happen it would be soon.
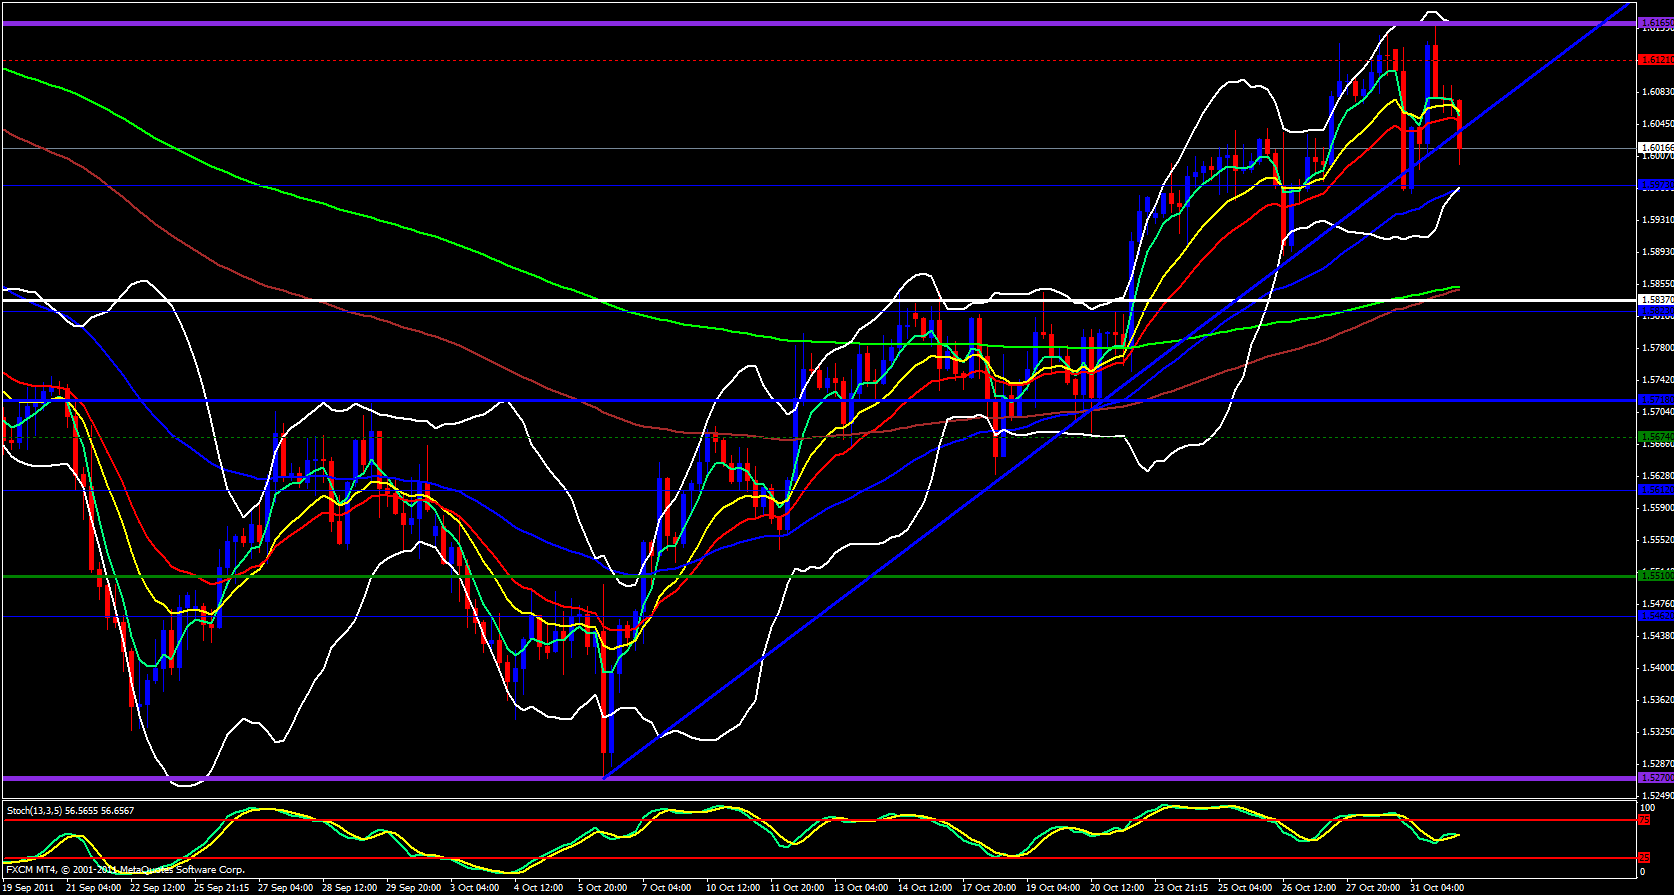
On to the 4 hour monthly pivot chart I can see that price has bounced off the previous month's high and the 5 ema is crossing below the 13 and an ascending trend line is broken. The 55 ema however is at the 1.5973 level and this overlaps with a fib level of last months range. The lower Bollinger band also happens to overlap with this area.
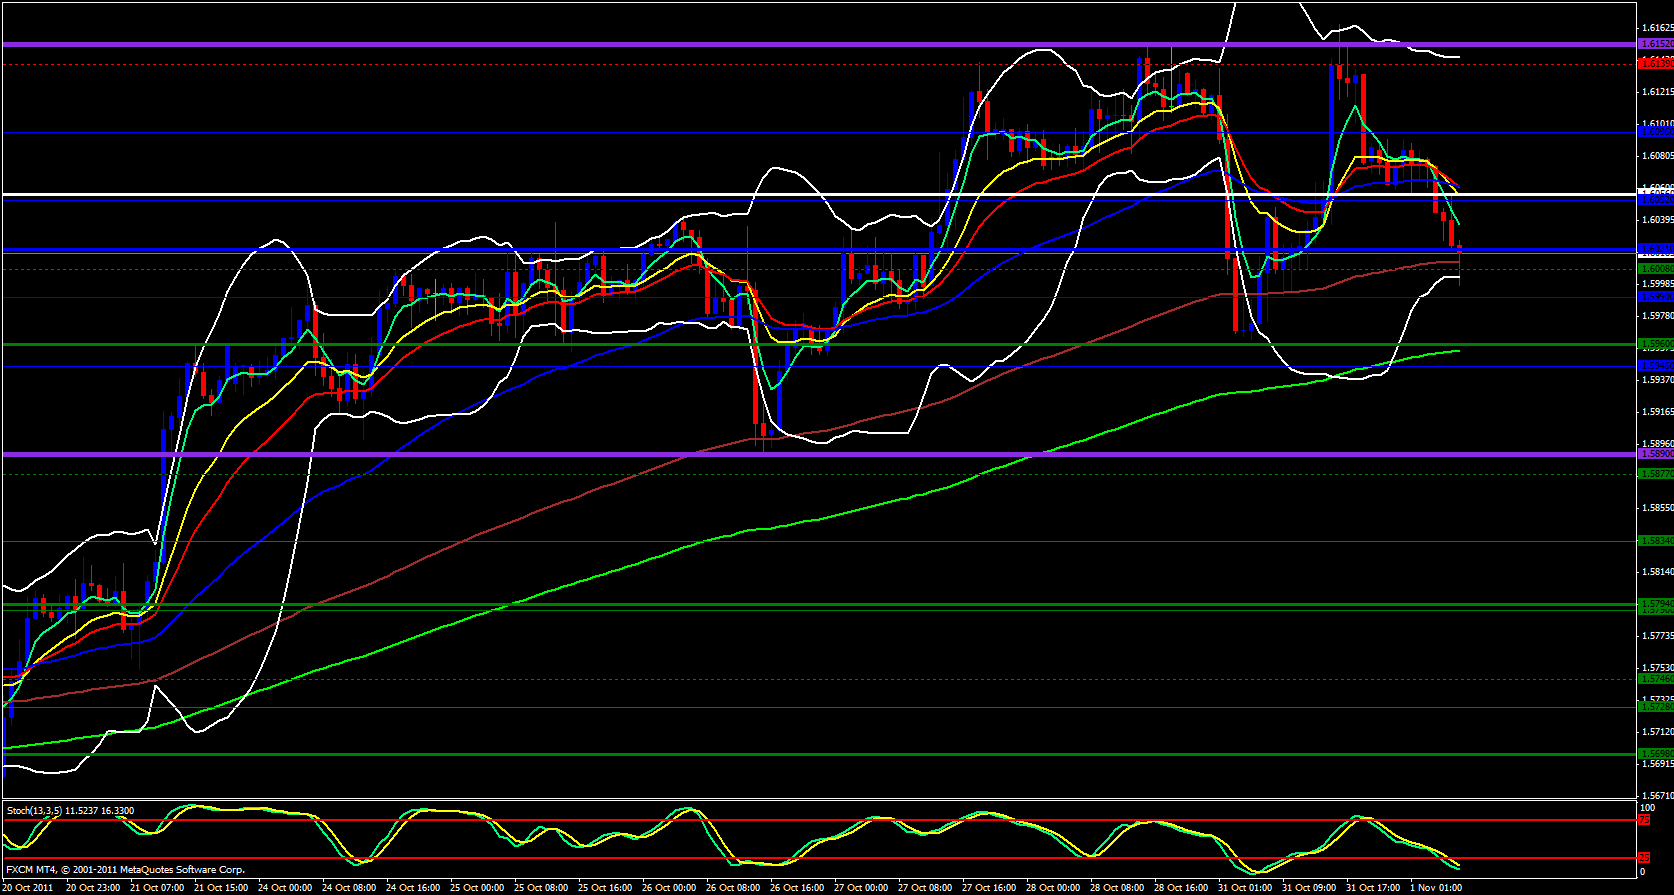
Moving on to the hourly weekly pivot chart price is at the M3 at 1.6008 overlapped with a lower Bollinger band but the band is beginning to open and point down. I am thinking that price could bounce a bit and wait for the 5 ema to catch up and push price further down possibly down to the weekly S1 at 1.5960 overlapped with the 233 ema where it may find support and head back up.
Moving on to the 15 minute daily pivot chart price has blown through the daily M2 at 1.6020 and is sharply riding the 5 ema down. The daily S1 awaits at 1.5972 where I would expect a reaction.


