By: Doug Rosen
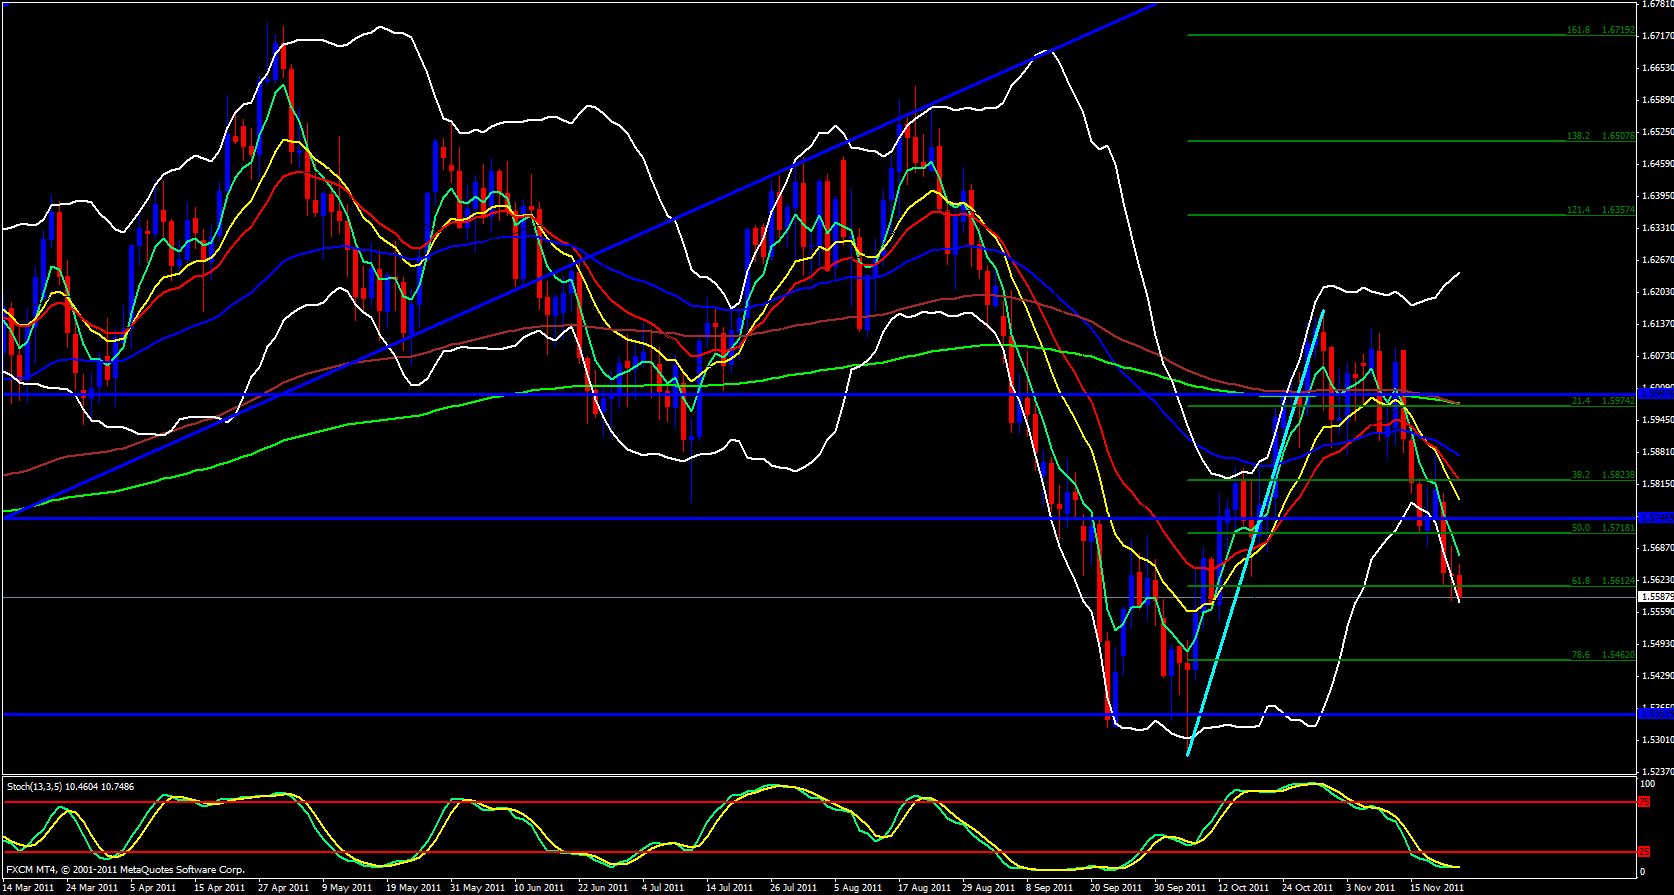
The GBP/USD starts off today as it did yesterday on the 61.8 fib of the recent move up at 1.5612. This is a very bullish fib level, however, the position of the ema's is very bearish for the pair. Price is riding the 5 ema to the downside and the lower Bollinger band is wide open pointing straight down. I would expect price to make contact with the daily 5 ema and be pushed down further, possible down to the next fib level, the 78.6 at 1.5462. I cannot ignore however, that the stochastic is in the oversold zone.
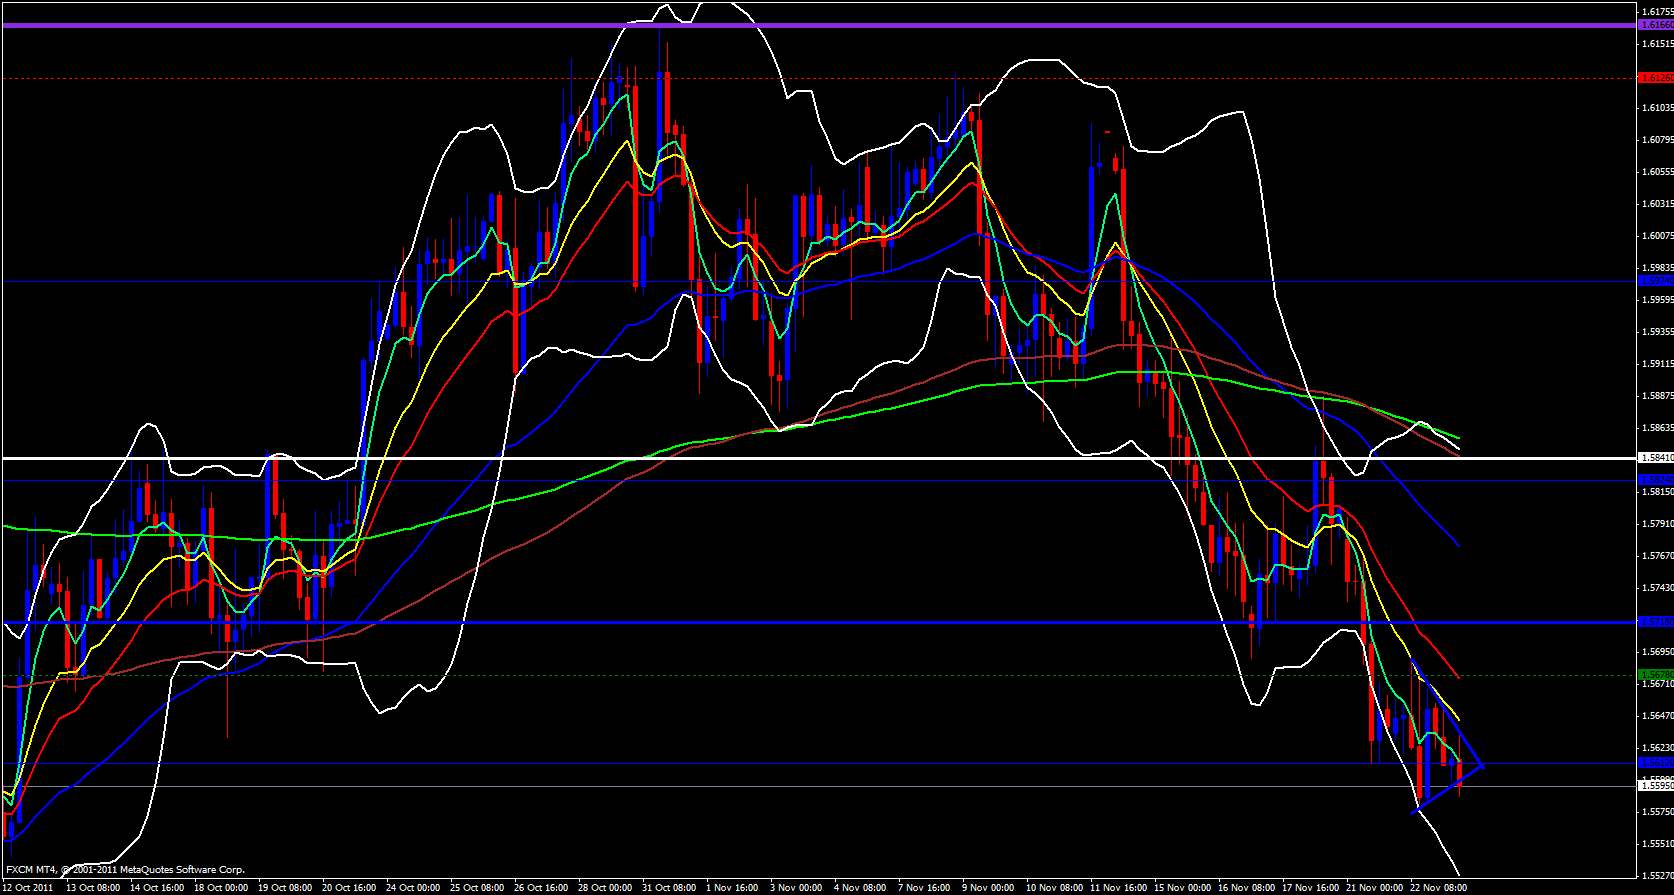
Moving on to the 4 hour time frame price seems to be in a bit of a triangle trap. I love these types of price traps since it narrows down what price may do. I will be watching for a break of this trap either to the upside or downside. Downside break is more realistic since we are in a downtrend and price has been making lower highs and is below the 5 ema which could force price down.
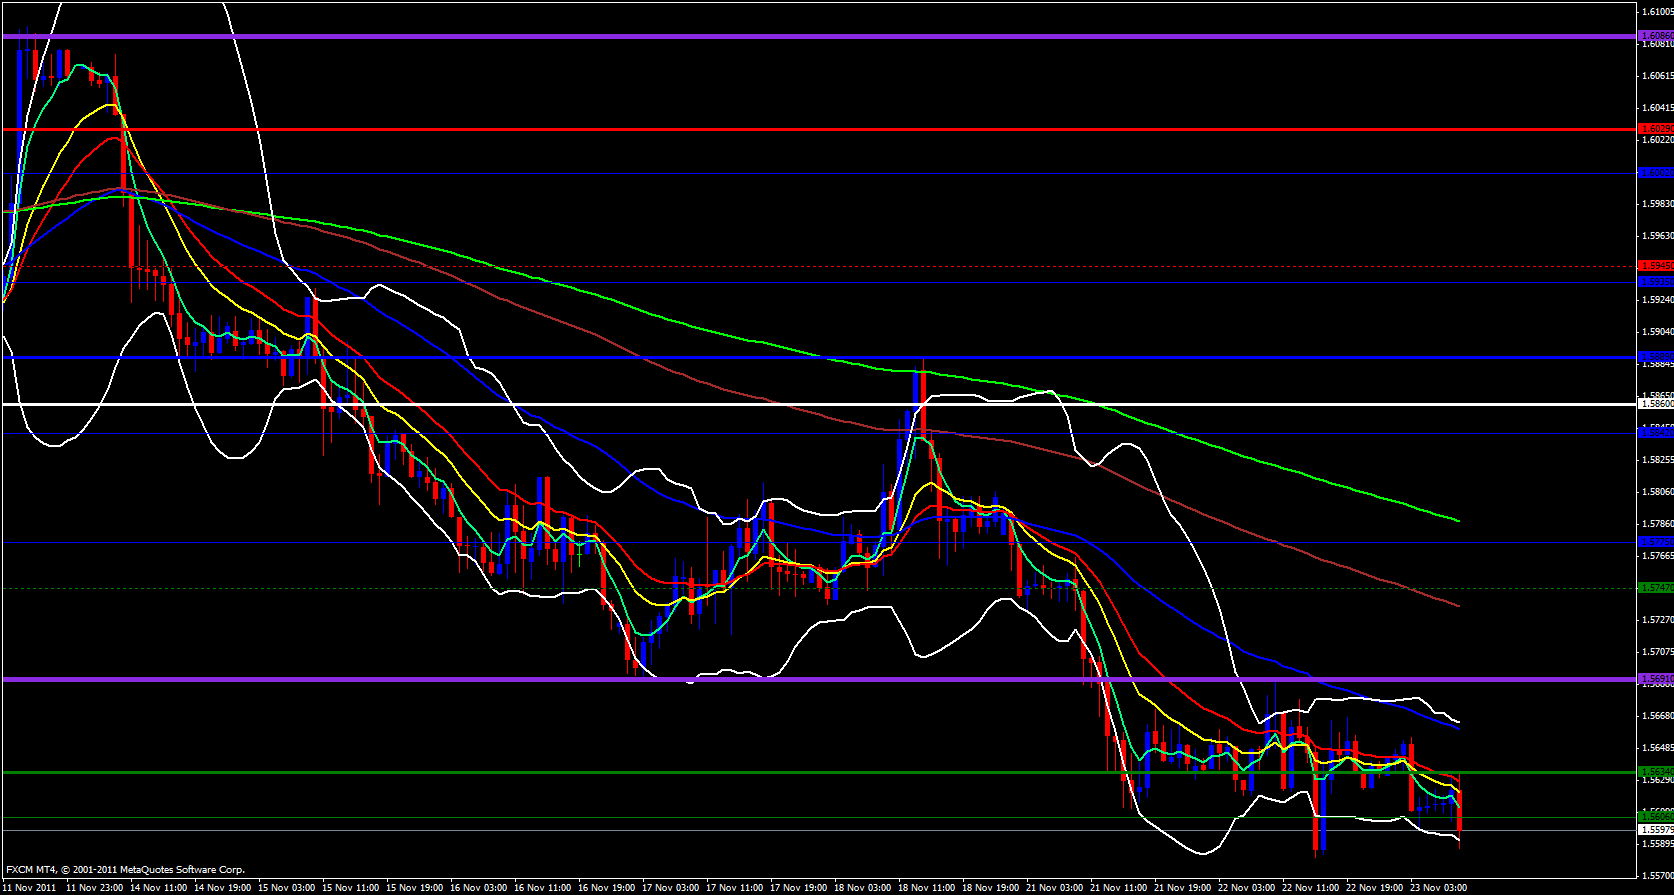
On the 1 hour time frame it looks like price may already be starting the breakout to the downside and the ema's seem to be pushing down hard on price.
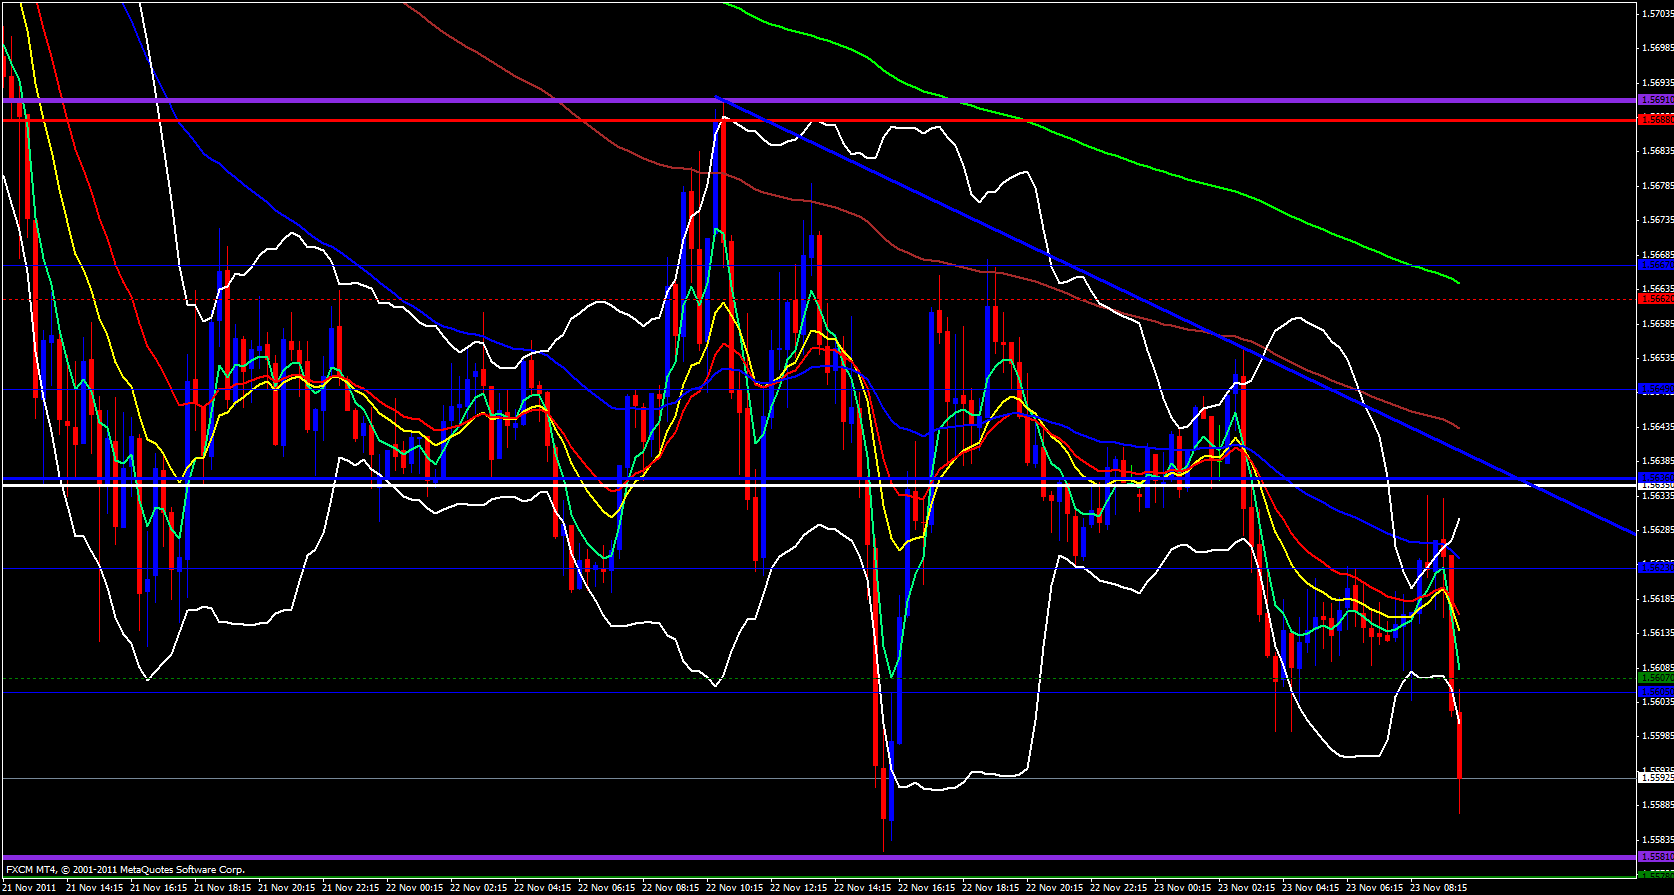
On the 15 minute time frame price is looking extremely bearish and the ema's are pointing straight down as is the lower Bollinger band. Watch out for a double bottom around 1.5581.


