By: Doug Rosen
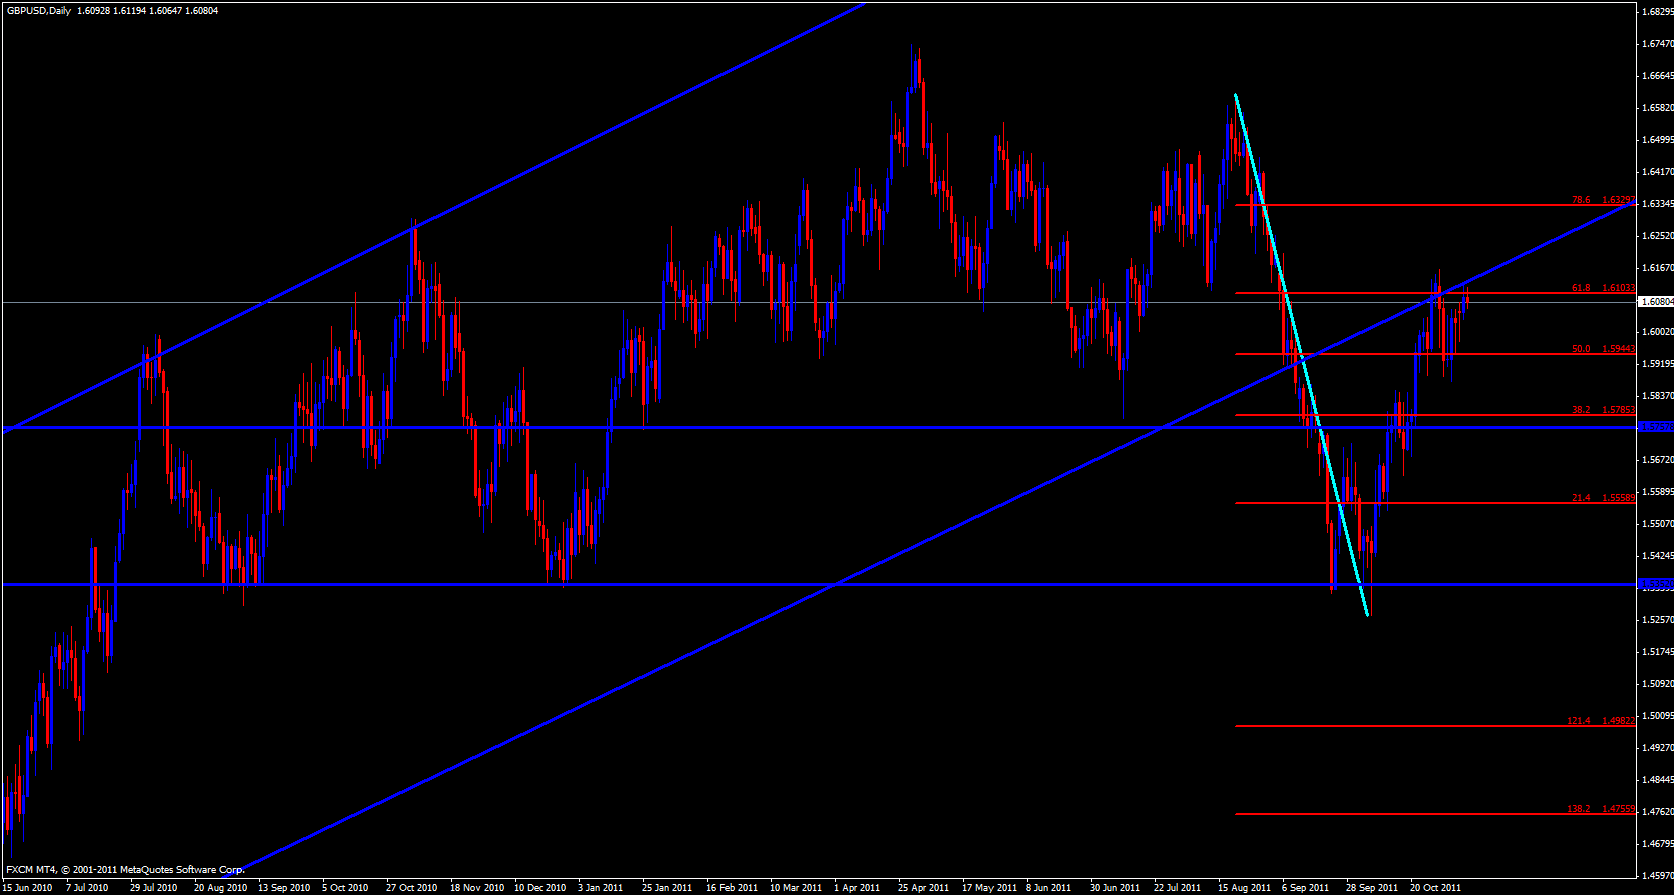
Beginning my analysis for this pair I will begin with the daily time frame and I can see that yesterday's price did poke through the 61.8 fib level for this pair and price is still riding along the 5 ema with the upper Bollinger open and beginning to point up. I am expecting that price will continue to rise beyond the 61.8 level at 1.6102 and the stochastic is pointing up. If it breaks this level it will soon be back within the price channel it was in a few months ago and may very well head up until it gets to the top of the channel and that will be a long way to go.
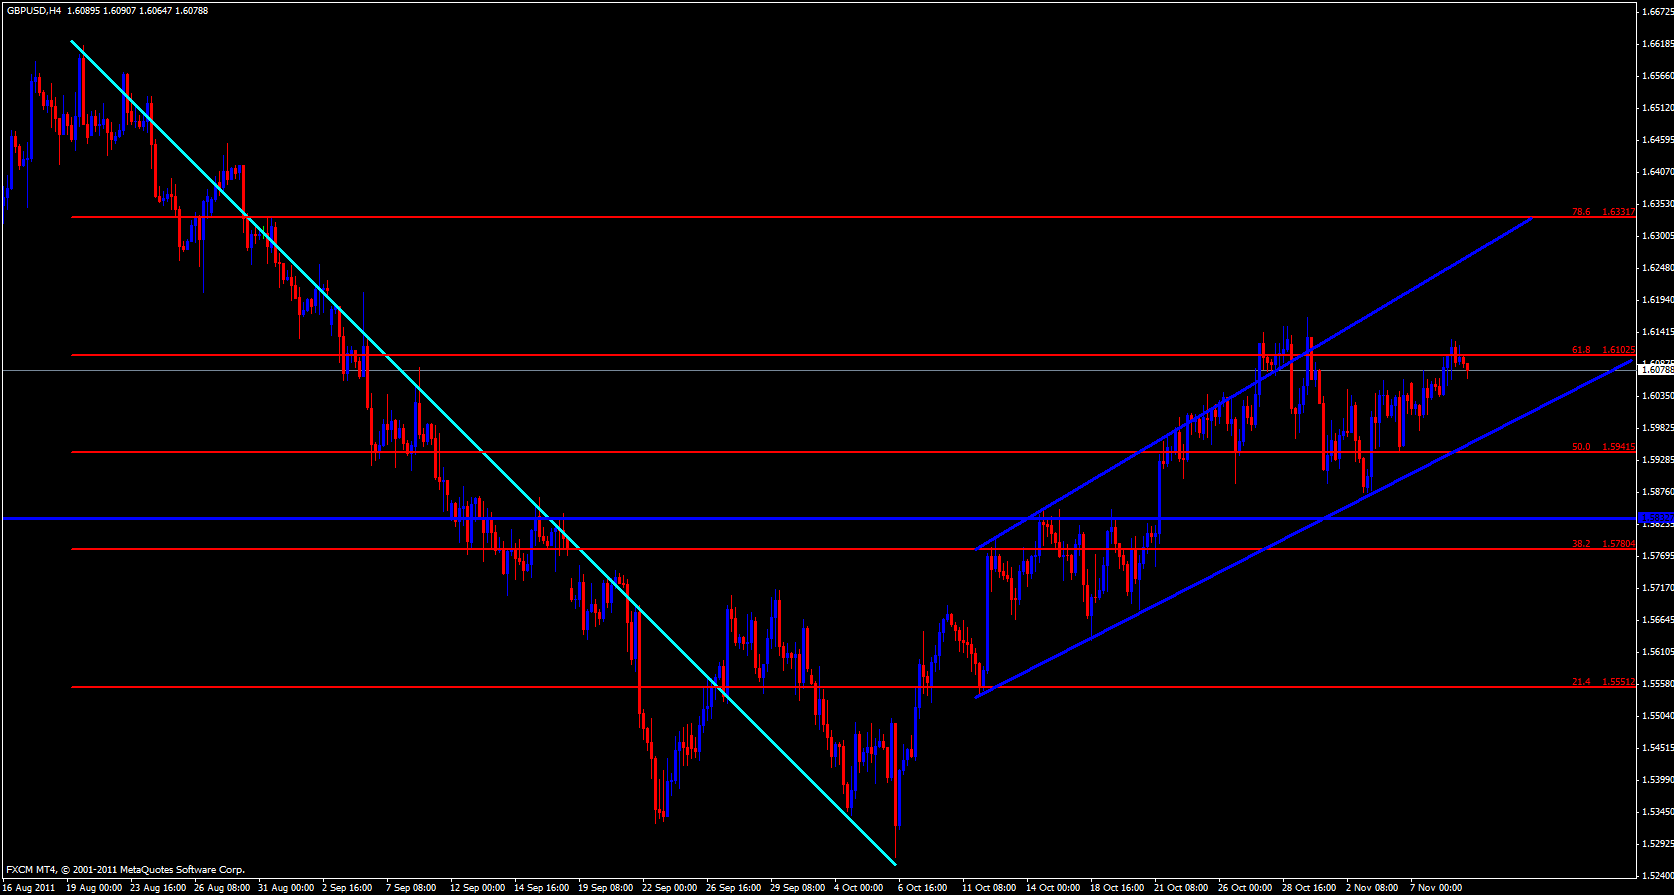
Moving on to the 4 hour time frame I can see that price is in the center of its channel and price has been coasting up along the ema's. The upper Bollinger band is open and pointing up but the 5 ema is beginning to point down a bit and the stochastics is in the overbought zone crossing down.
Moving on to the hourly time frame price is in the center of its channel and making contact with the 55 ema overlapped with last week's high and the lower Bollinger band. Stochastics is heading down into the oversold zone and will soon have an opportunity to recycle and head back up.
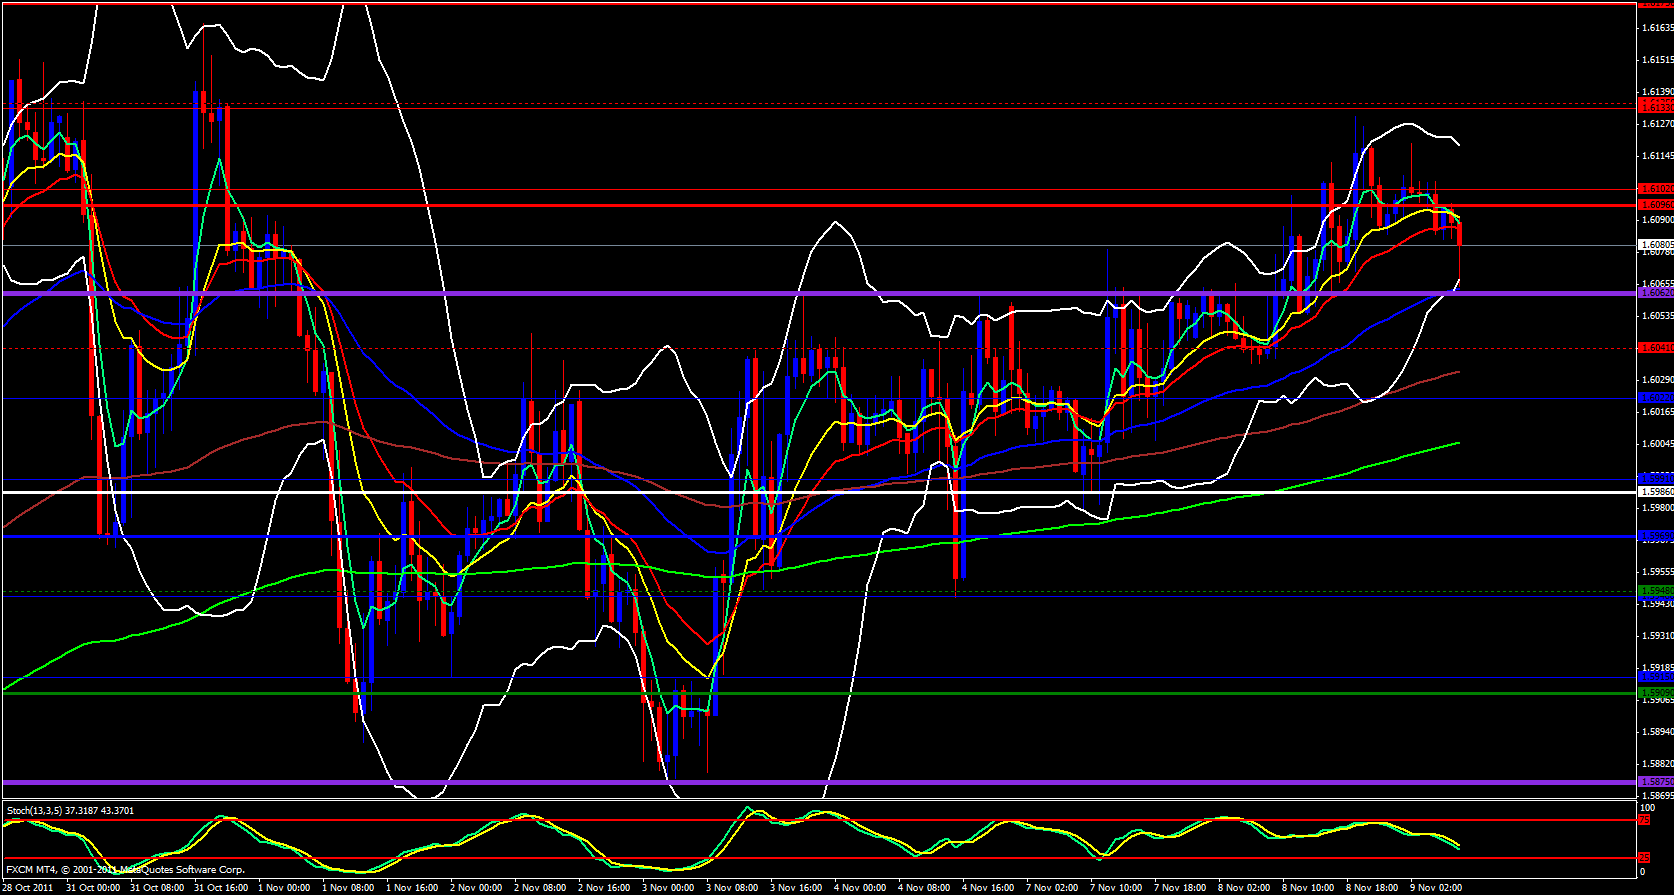
Finally moving on to the 15 minute time frame price is approaching the 233 ema which overlaps with the daily M2 pivot at 1.6061 and the stochastics is in the oversold zone. Price just recently fell below the daily central pivot at pivot point at 1.6083 and is just below the monthly M3 at 1.6121 and just below the weekly R1 at 1.6096.


