By: Doug Rosen
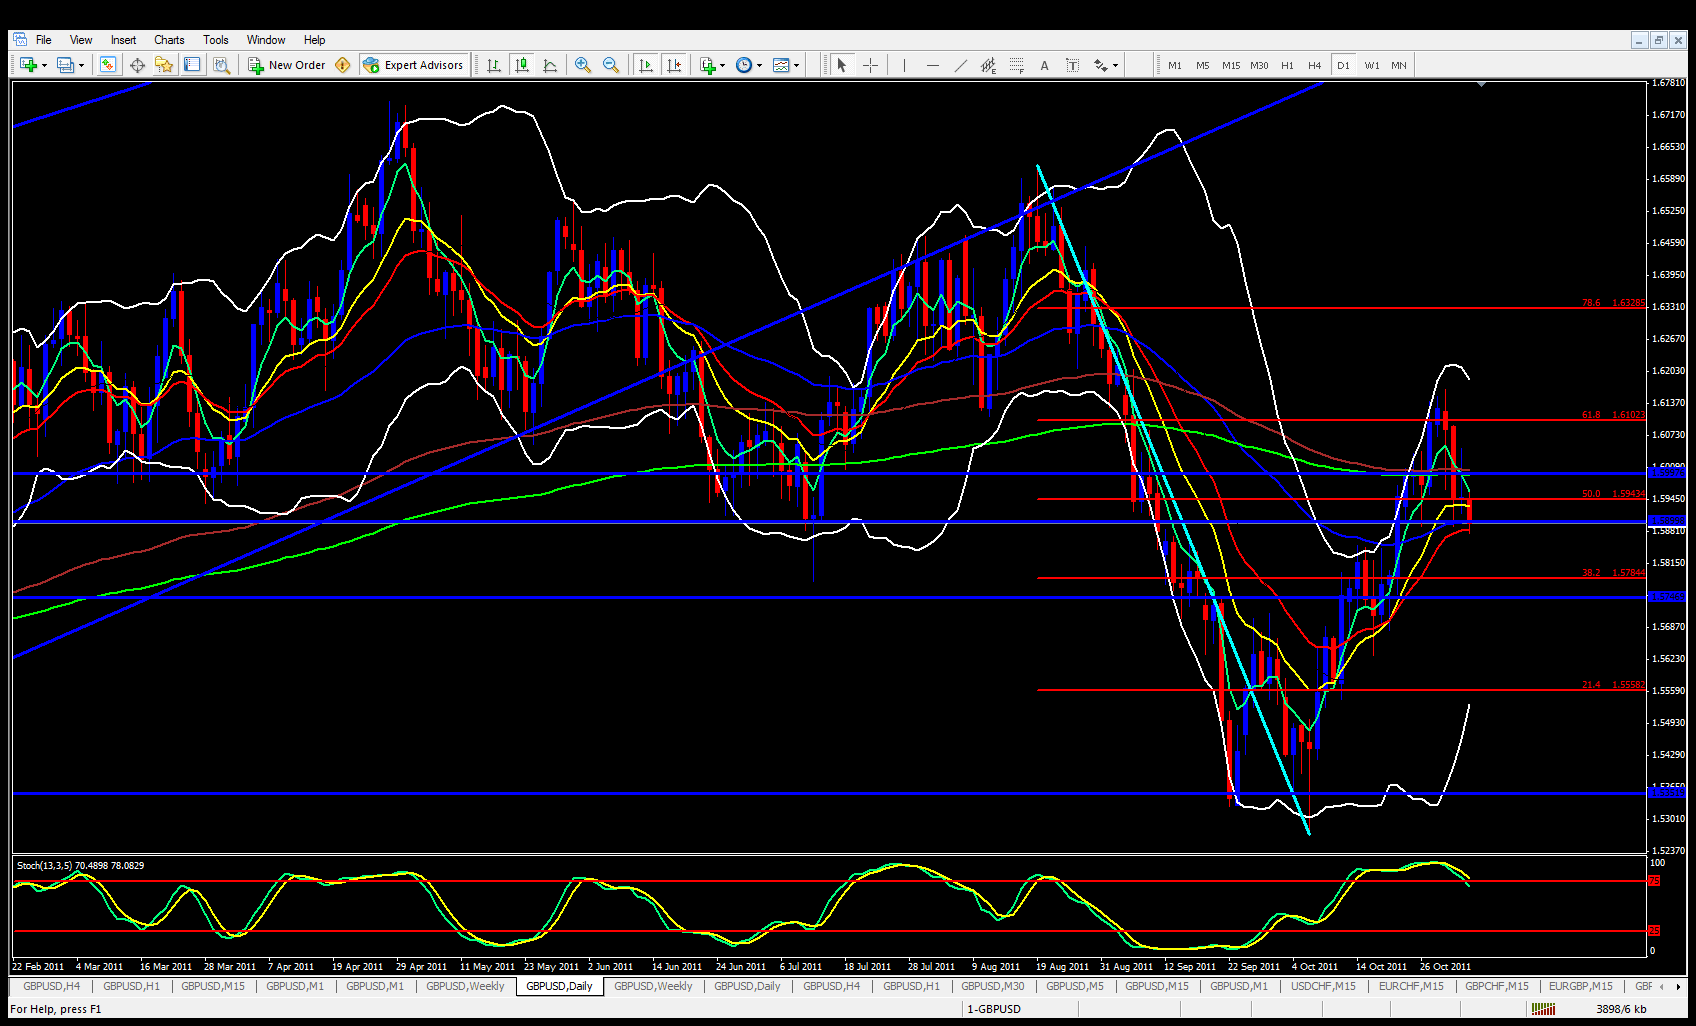
On the GBP/USD daily chart, it is very obvious price has bounced off the 61.8 fib level a few days ago and the 5 ema has crossed below the other ema's and the stochastics is heading out of the overbought zone and pointing down.
The upper Bollinger band is also pointing down. What I cannot ignore however is that price is sitting spot on the 21 and 55 ema's and on the daily chart these ema's do hold a lot of weight and price is at a fib level to the upside.
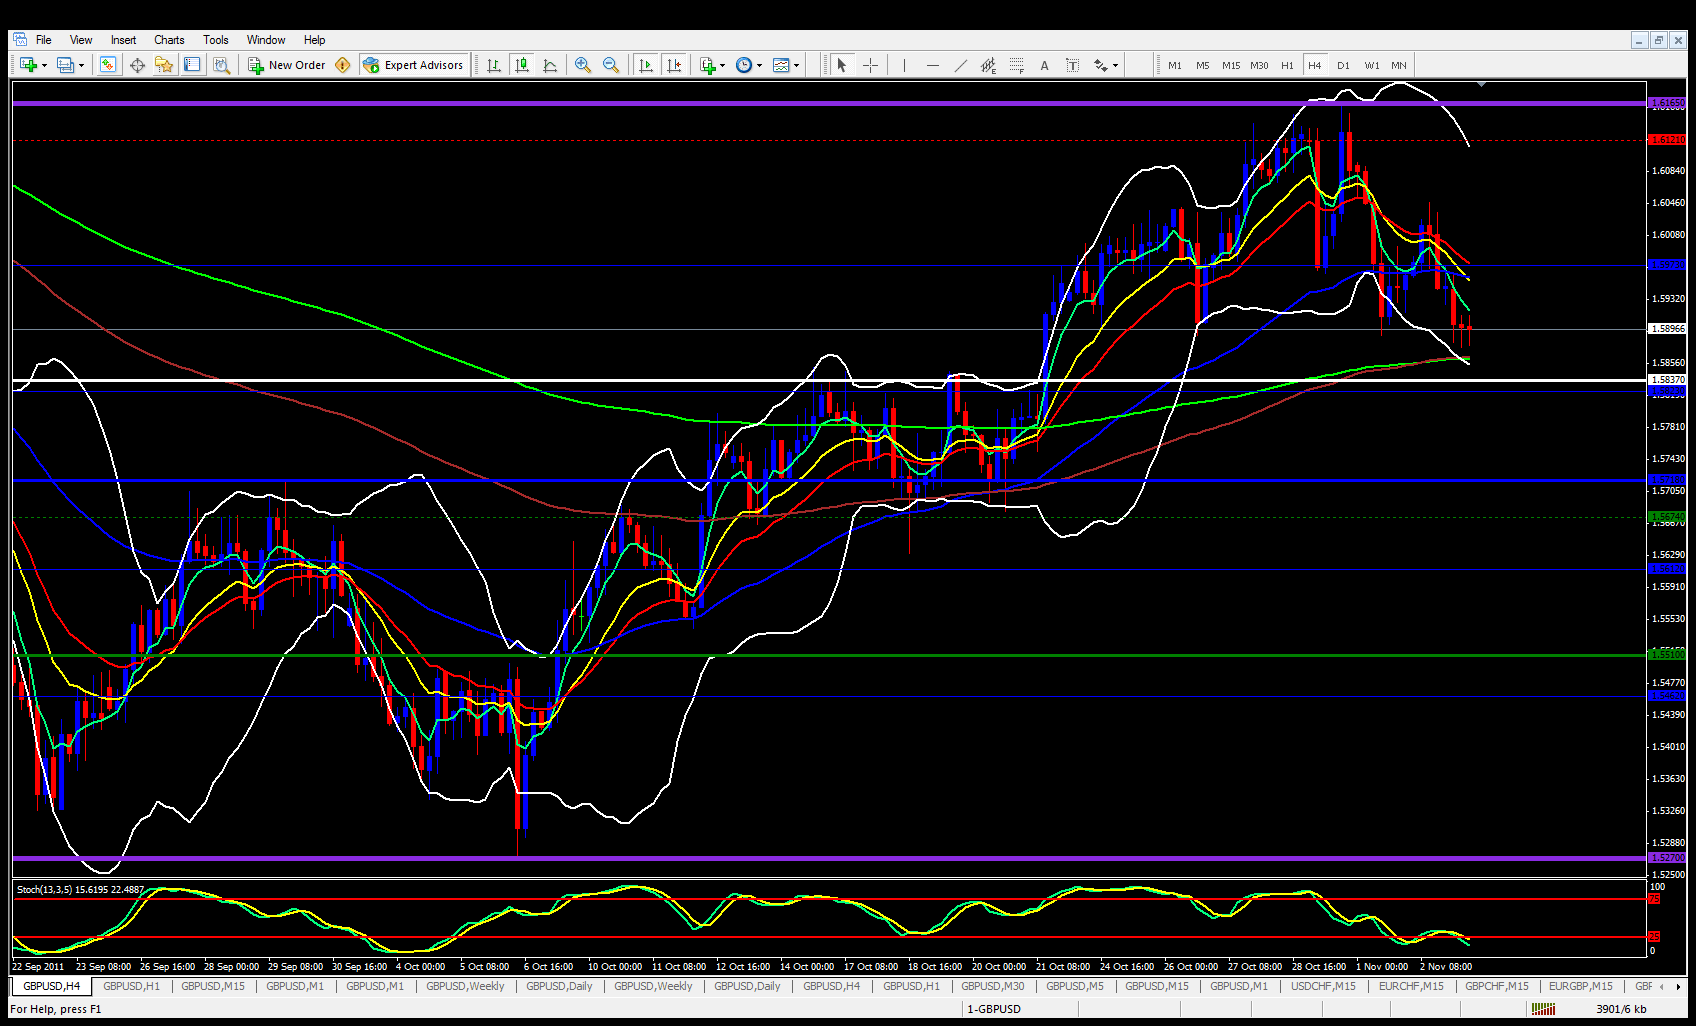
Looking at the 4 hour chart price is below the 5 ema but is coming into contact with the 233 and 144 which is overlapped by the lower Bollinger band. A reaction should be expected in this zone. Just below that area happens to be the central pivot point.
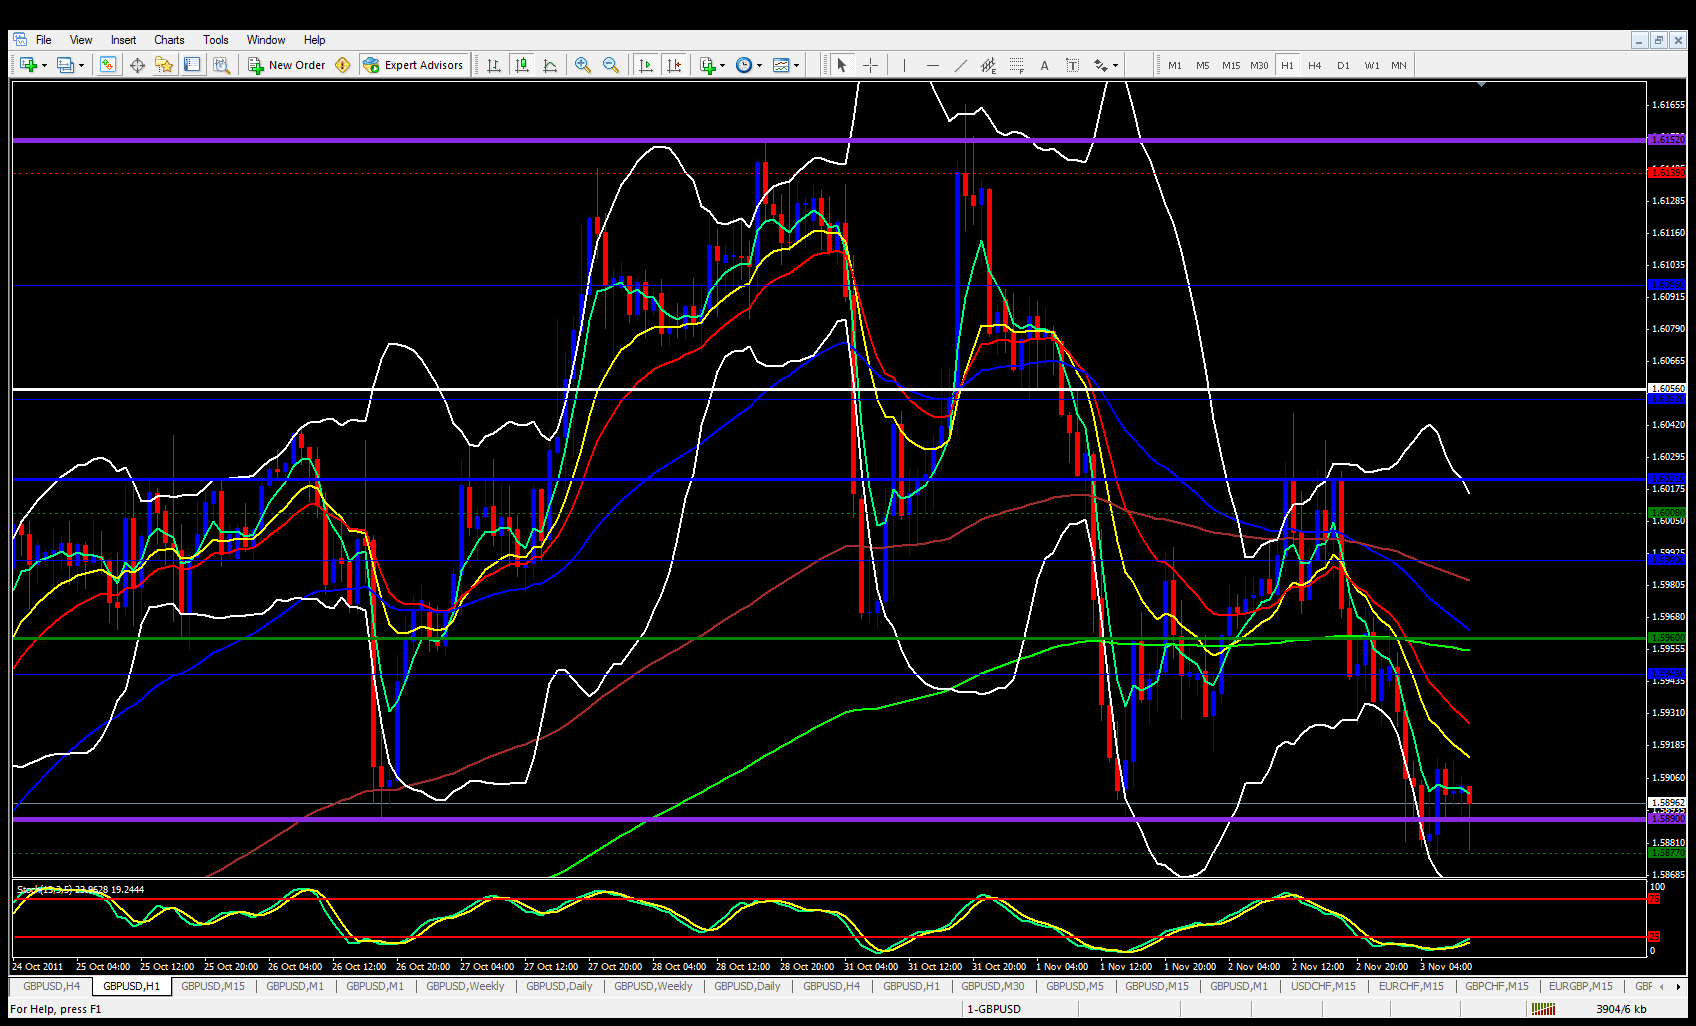
Moving onto the hourly weekly pivot chart price has bounced off the M1 pivot at 1.5877 and has made contact with the 5 ema which seems to be forcing price back down.
Finally, on the 15 minute daily pivot chart price is below yesterdays low but fighting with the S1 at 1.5893. Price is up against the 21 ema and there is a bit of a fight. This pair is caught in between layers of both support and resistance but the trend seems to be to the downside.


