By: Doug Rosen
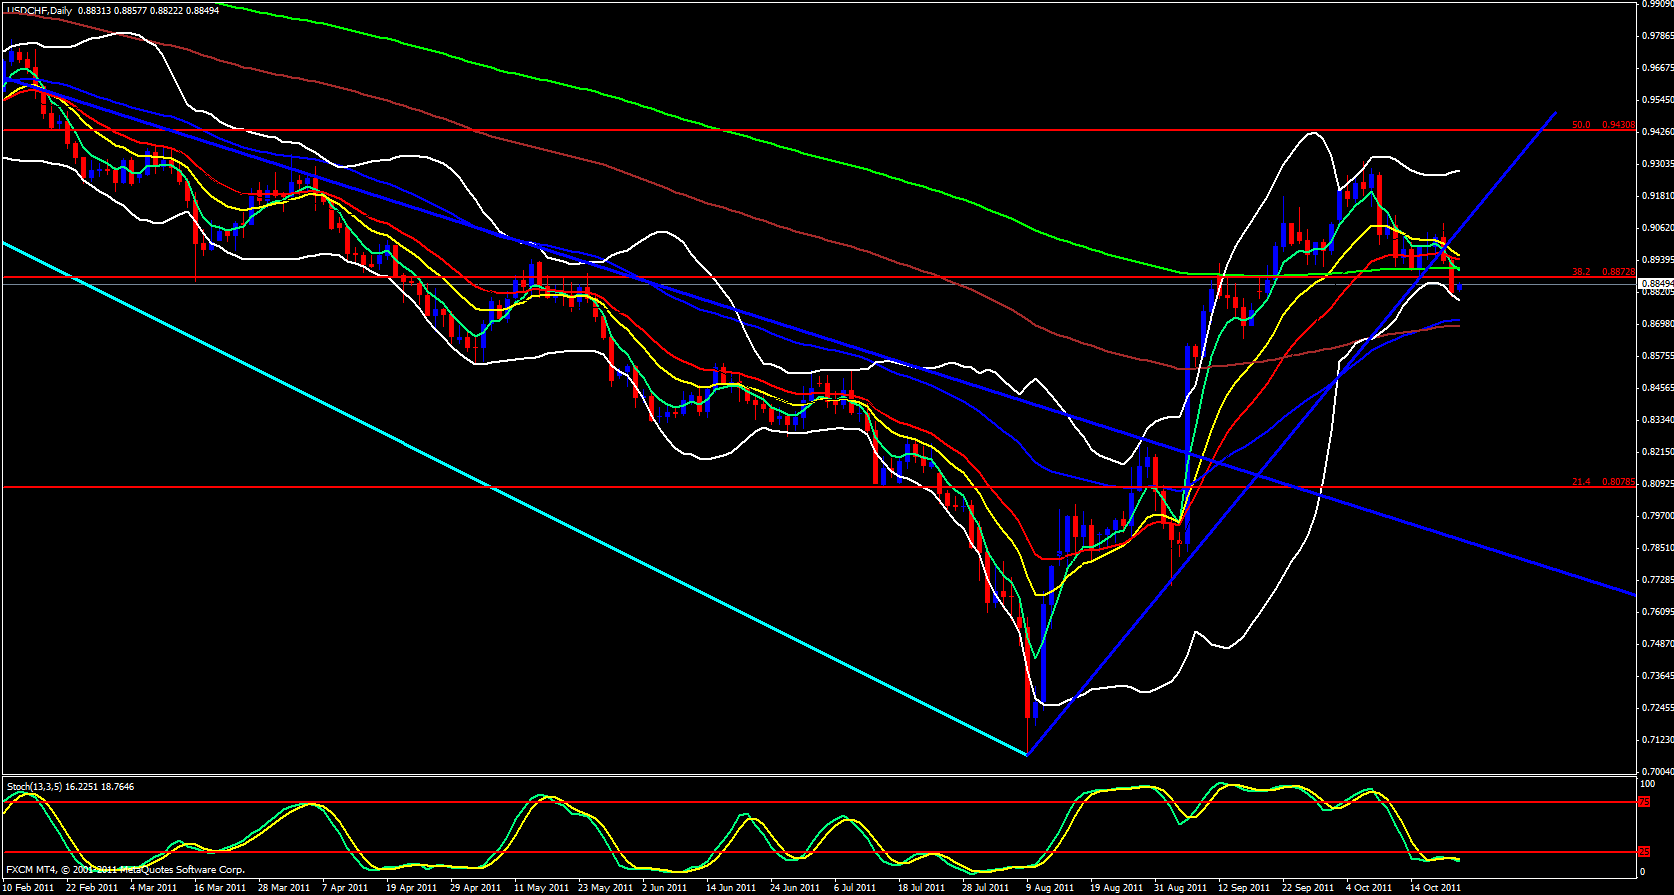
I start my analysis on the Swissy looking at the weekly chart. Last week was a very bearish week for this pair and at this time the 5 ema is above weekly price action with a stochastic in the overbought zone. Moving over to the daily chart we have seen some ema crossovers to the down side and the lower Bollinger band has opened up and is pointing down. The stochastic is in the oversold zone but it seems to not want to recycle back up and have another crossover from within the oversold zone which can be a very bearish indication.
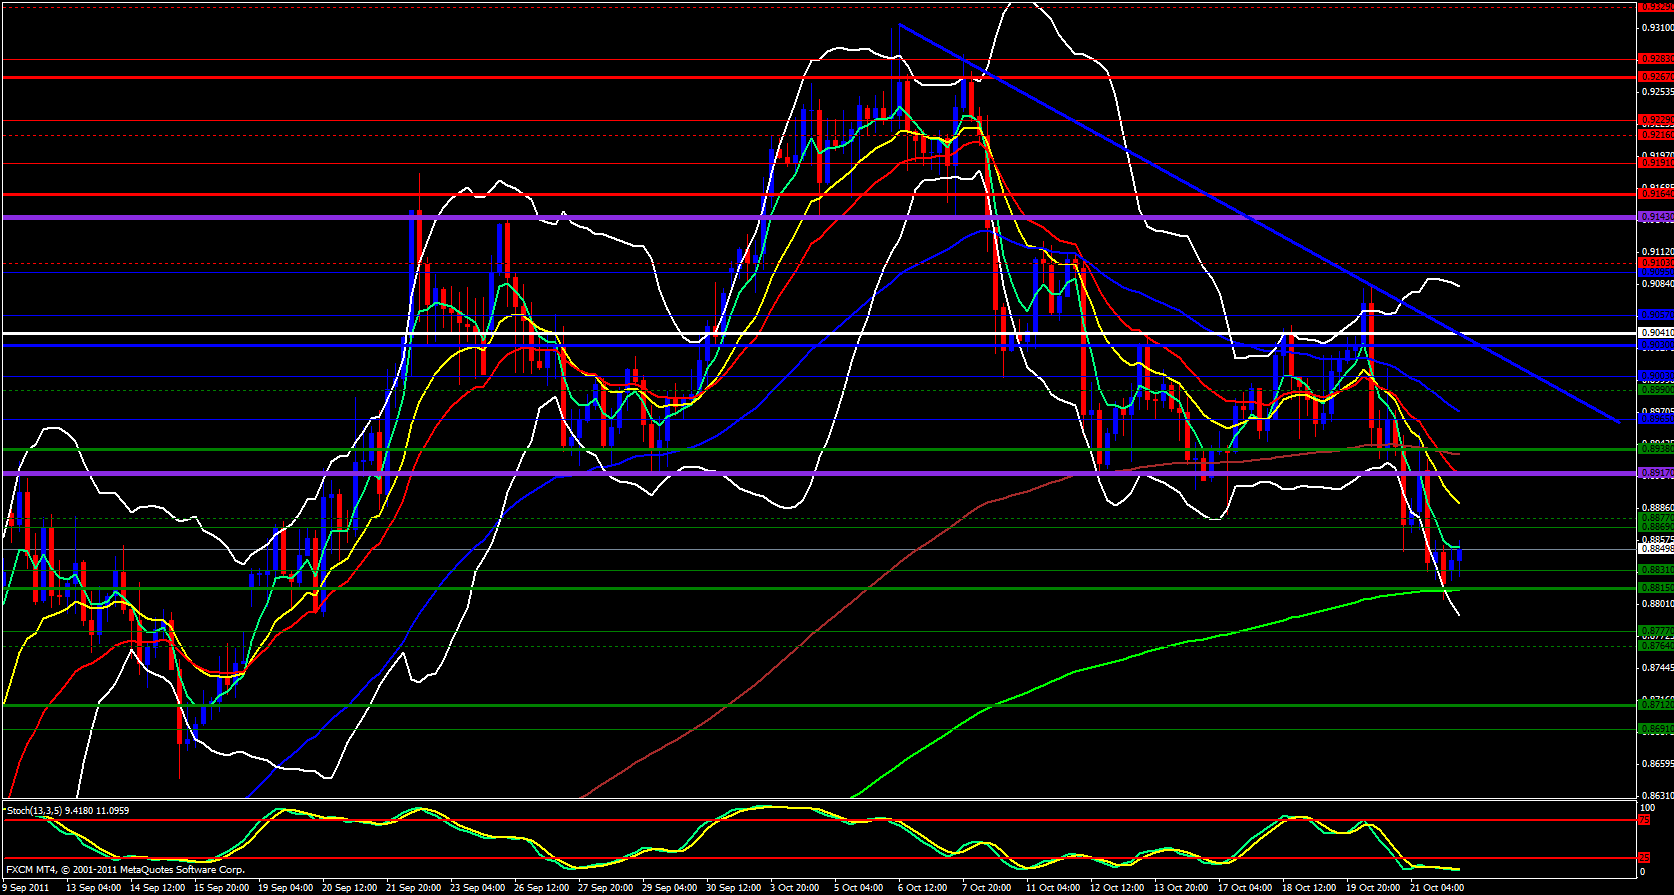
Moving on to the 4 hour chart I can see that price has bounced off the 233 ema which happens to overlap with the monthly S2 so of course there will be a bullish retracement at that level, however, the monthly M1 is at 0.8877 and the 13 ema is heading down to that level so I don't expect price to go much beyond that zone.
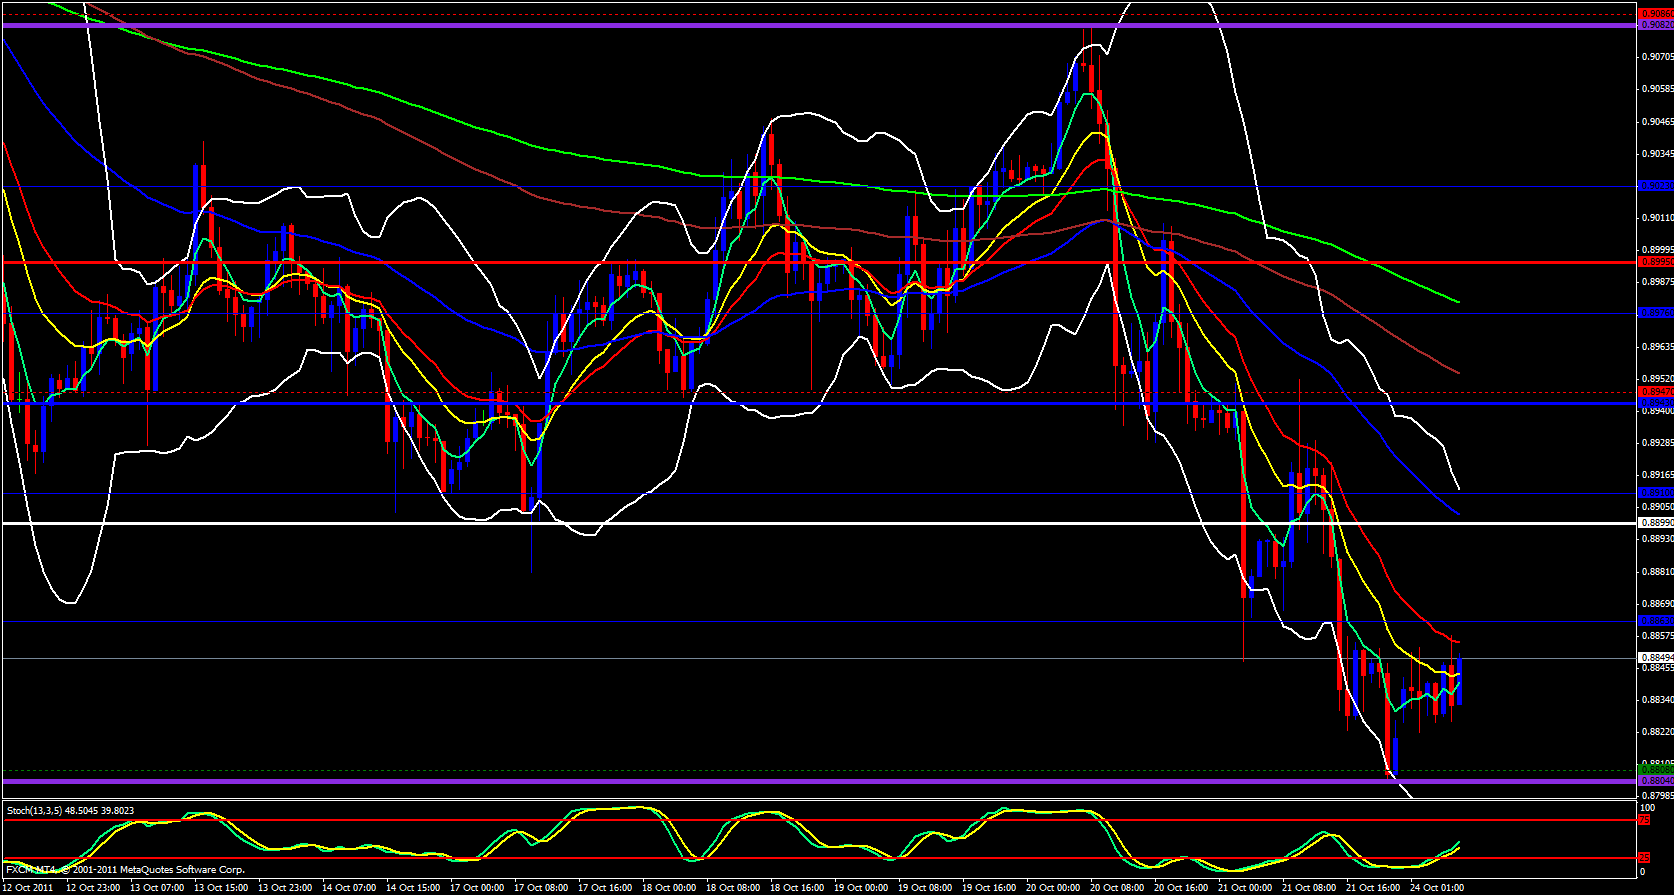
Zooming in further to the hourly chart I see the new weekly pivot point is at 0.8899 overlapped with a falling 55 ema and an upper Bollinger band. I would expect price to retrace to somewhere between 0.8880 and 0.8900 then to continue to fall. This drop obviously means USD weakness.
Looking at the 15 minute chart for this pair I see lower highs and lower lows and the 15 minute 144 ema is at 0.8879 which overlaps with the daily S1 Pivot with the 233 ema falling and currently at 0.8905 which all seems to coincide with the bearish action I see on the hourly chart.


