By: Fadi Steitie
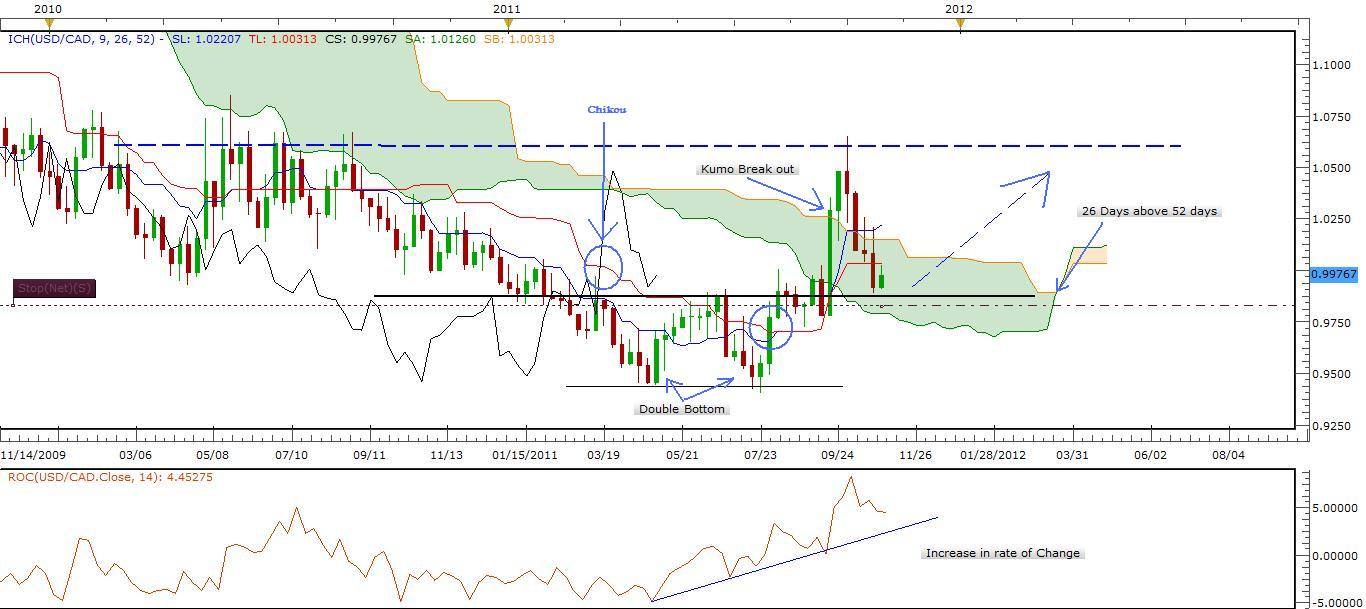
Just looking generally at weekly Ichimoku Averages, We notice an increase in Rate of Change indicator in the same time with a Double bottom trend action which indicate a change in trend direction. We notice also here a positive cross in Cloud (Kumo) 26 days above 52 days which gives a switch in momentum from negative to positive. Trend jumped above the cloud and bounce back for a correction reaching support level at 0.98665 (Black line). It still above the 26 days(Red) Kejun Sen and Chikou span (Past 26 days).

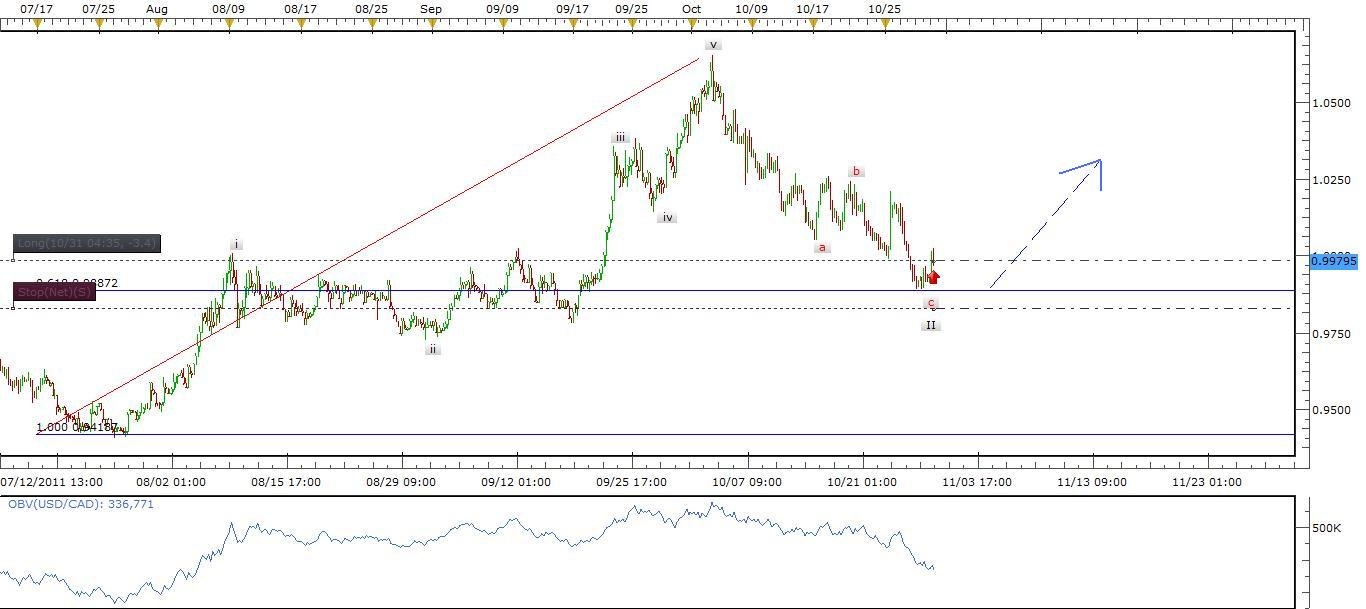
If we look at more details in hourly chart using Elliott Waves counting, We notice a complete motive wave with a ZigZag correction reaching 0.618 Fib level which It shows an end of wave II and expecting a larger wave III on the way.
Summary:
Currency: USD/CAD
Trend Expected Direction: UP
Strategy: Elliott Waves
Description: End of Wave II with a ZigZag Correction reaching 0.618 Fibonacci Level with a drop in On Balance Volume Indicator. I expect wave III to start
Target Area: Open
Stop Loss: 0.98260

