By: Doug Rosen
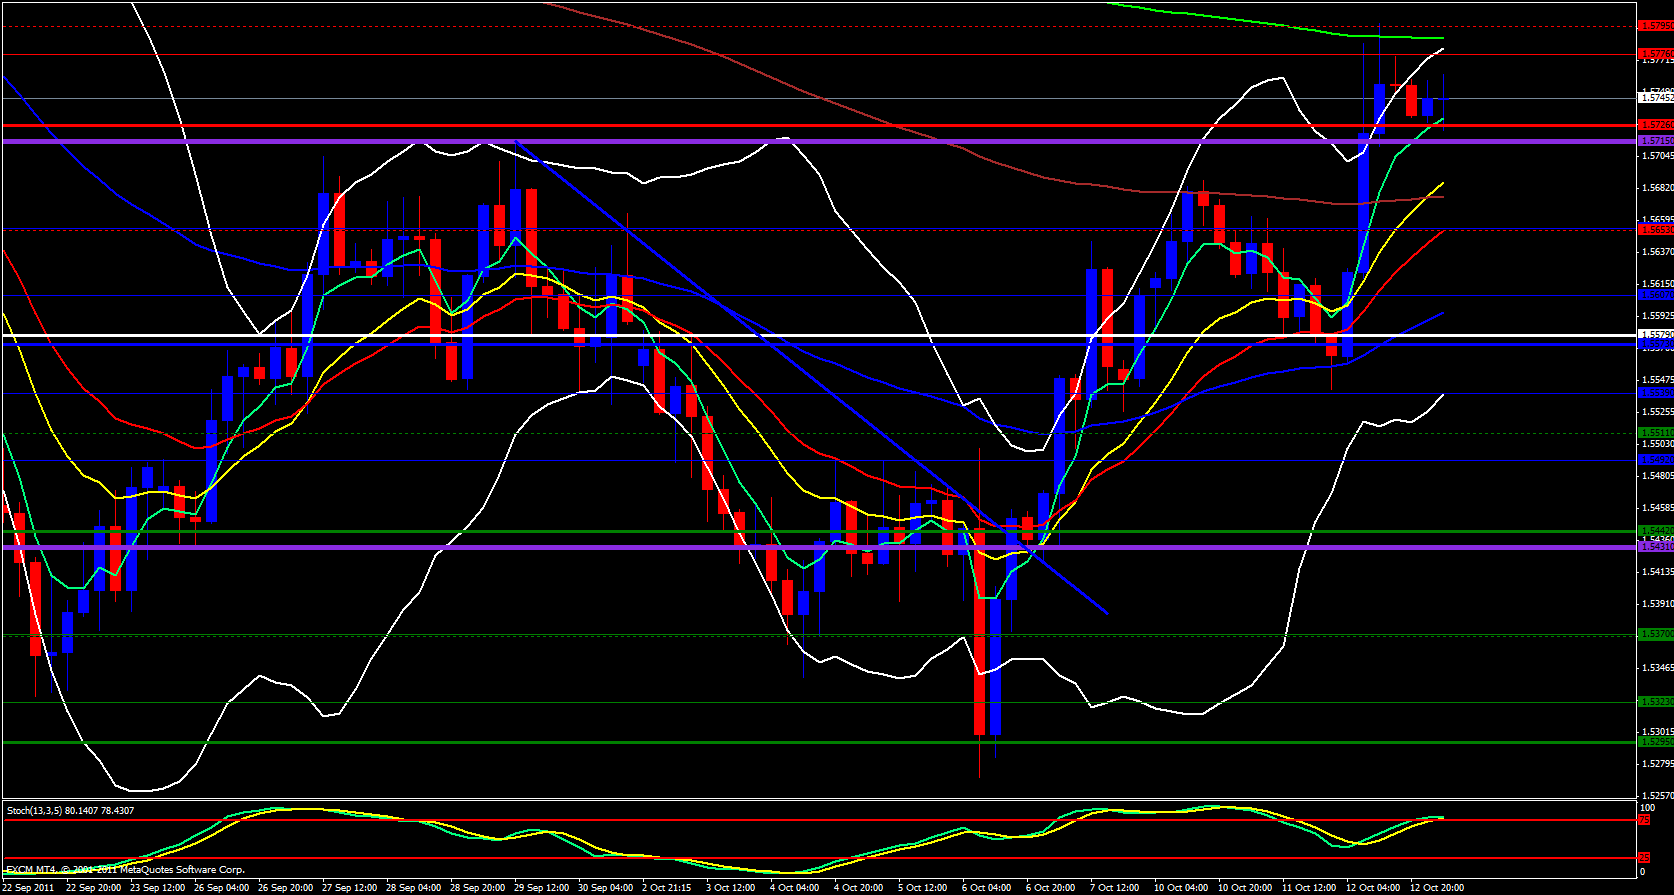
GBP/USD pair, even though it has been bearish up until today, it has reached the 38.2 Fib level of its recent move down and the 38.2 fib overlaps with the daily 55 ema.
Daily stochastics is now into the overbought zone and price has poked through the Bollinger Band. Moving over to the 4 hour chart it appears that price is riding the 5 ema yet the 4 hour stochastics is int he overbought zone crossing down.
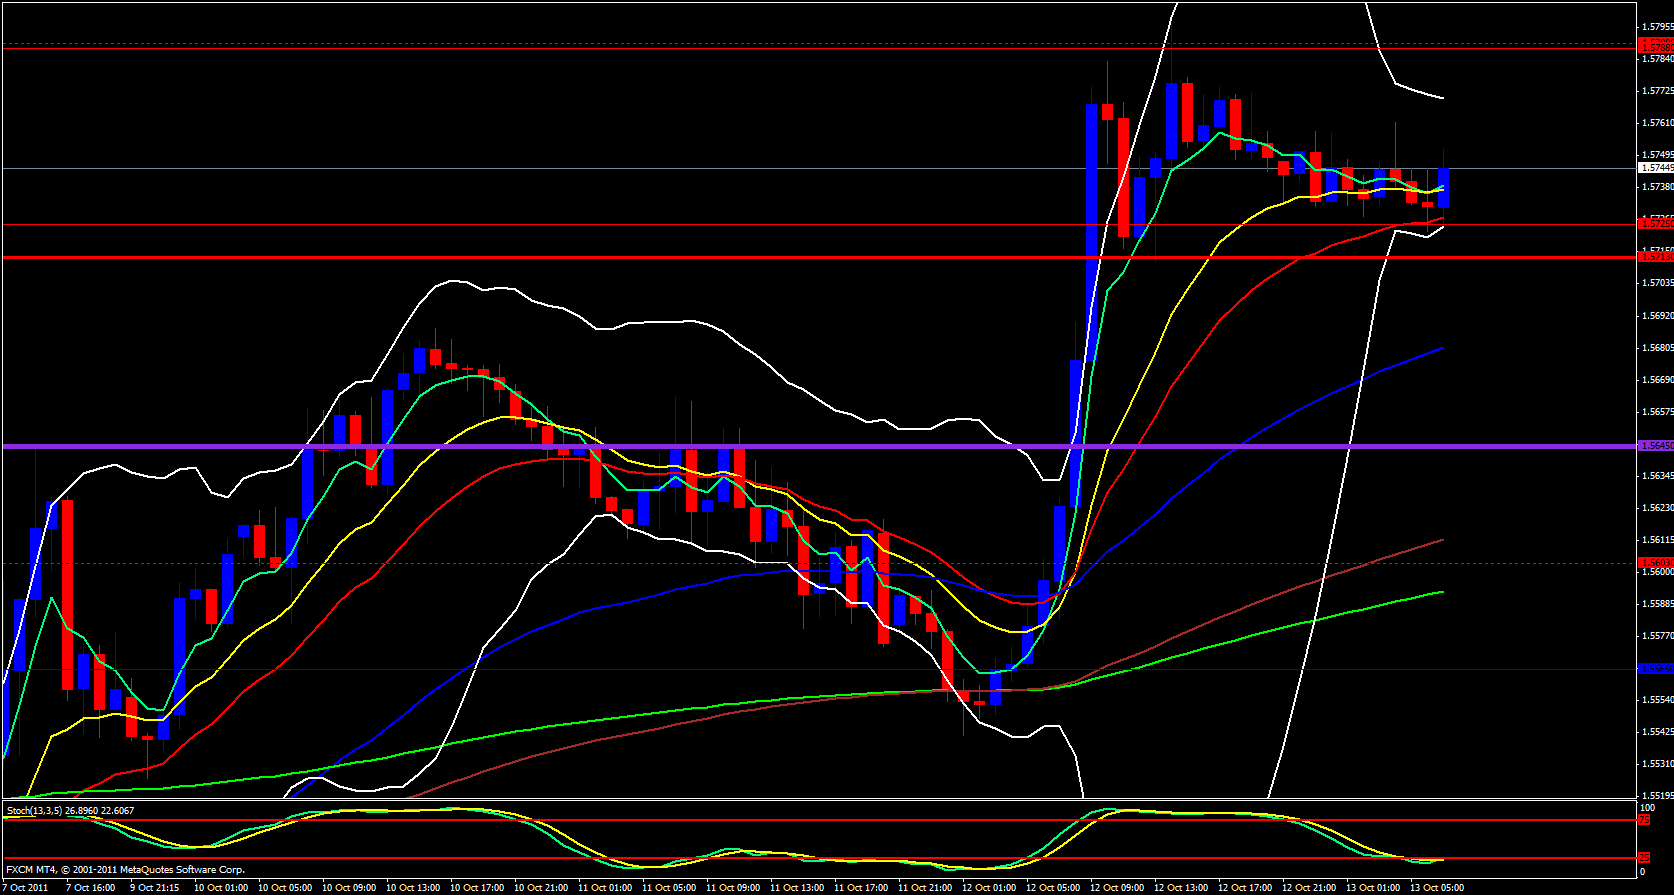
Moving on to the hourly chart the ema's are close together and the Bollinger bands are narrowing.
Finally, I look at the 15 minute chart and all I see is consolidation. after all, yesterdays moves were very big and after a day of big moves consolidation usually follows. Not much going on today with this pair.


