By: Doug Rosen
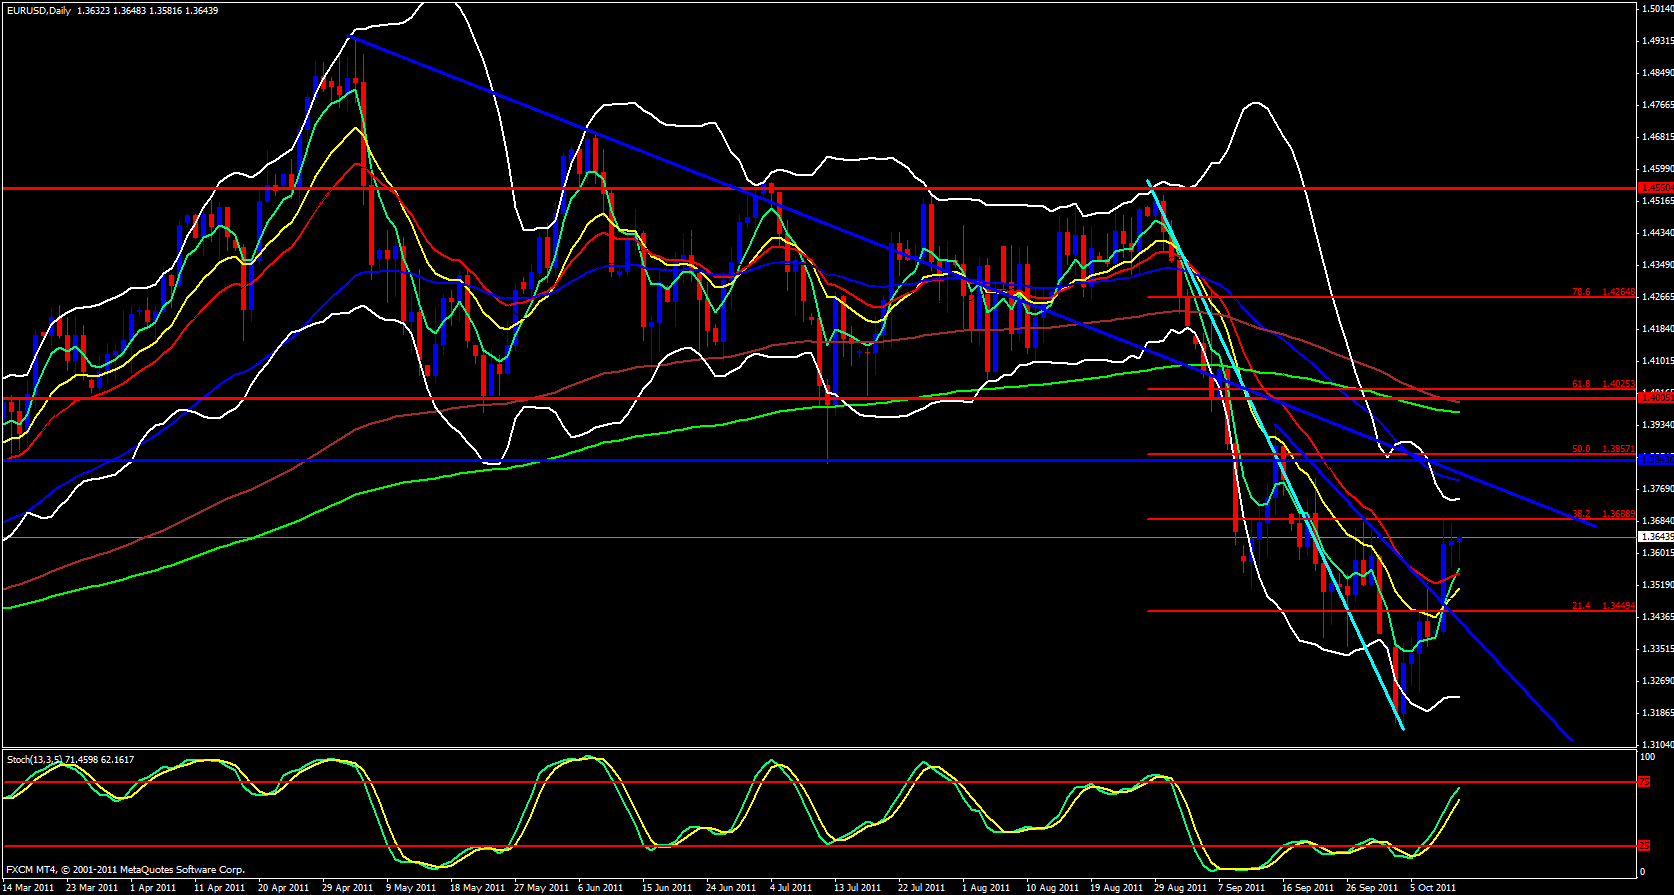
Starting out with a brief glance at the weekly chart for this pair I can see that we did bounce off the 50.0 fib and the stochastic is in the oversold zone. Moving over to the daily chart it has a bullish look about it since the 5 ema has crossed above the 13 and is crossing the 21 ema, stochastics is still in the trade zone but near the top I need to note and price has in fact busted the descending trend line I have been speaking about since last week. One thing I will point out, price is approaching a 38.2 fib of the recent drop. Will this stop EUR/USD bullishness? I don't think that the 38.2 is enough to do that but I do expect a pullback at that level since there will be some profit taking at that level.

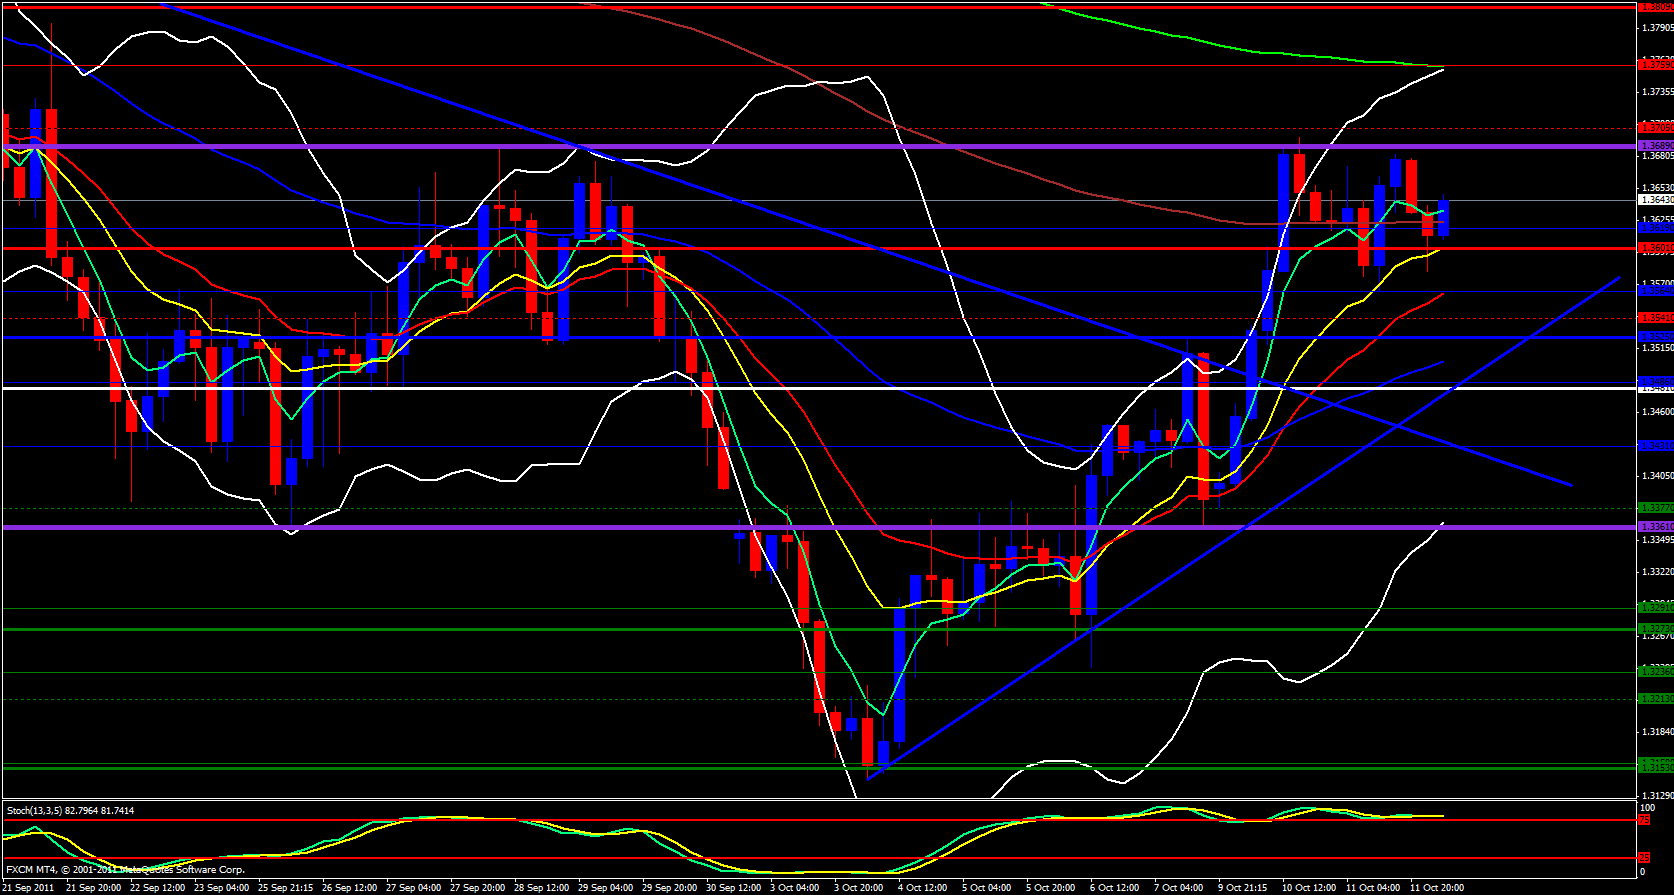
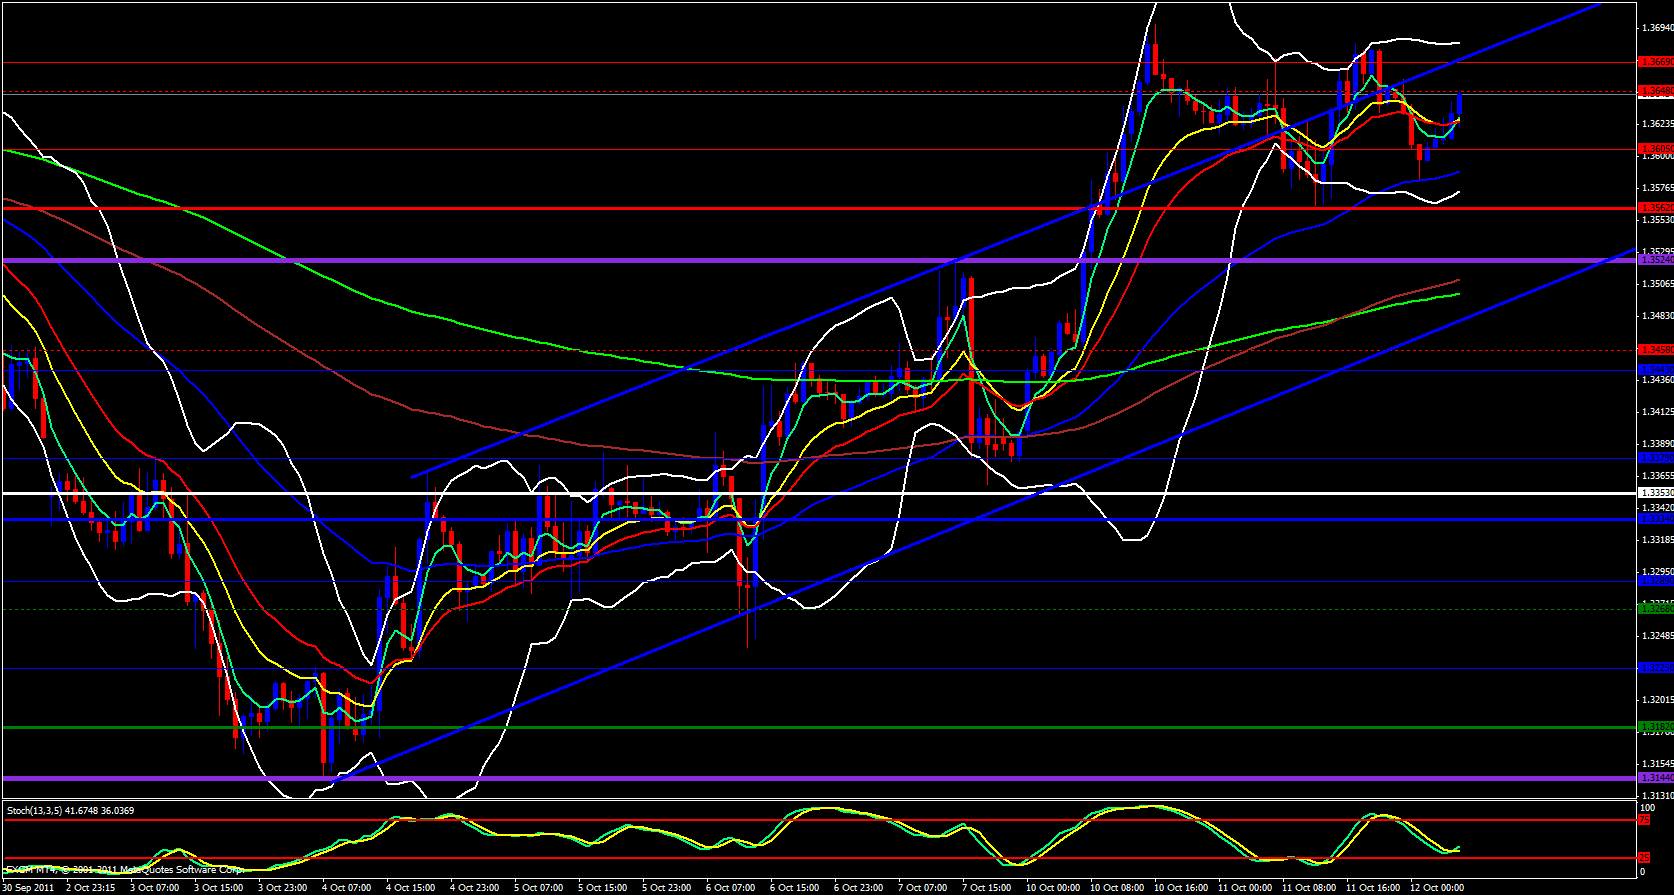
I can also see when I look at my pivot charts that last month's high overlaps with the 38.2 fib I was just speaking about so there is no question about it, there will be some fight at the 1.3689 area. Moving on to the hourly chart I see that the 5 ema is crossing above the 13 and 21, very bullish indeed and the stochastics is at the bottom of the trade zone crossing up. I also want to note that we are back in a price channel which was broken but now back in and I believe this was just a retest and that price is going to make its way back out. Finally, I am checking out the 15 minute chart and I do see that the upper Bollinger Band is opening and pointing straight up give price permission to flow out and that price is beginning to ride the 15 minute 5 ema and we are above the daily central pivot point. This pair is still bullish to me but based on the USD/CHF chart which is in fact a reciprocal of the EUR/USD I think we are in for some choppy price action so be careful. I personally would wait for a break above the 1.3700 psychological level which also happens to be above yesterdays high and the daily R1 before taking any long positions.


