By: Doug Rosen
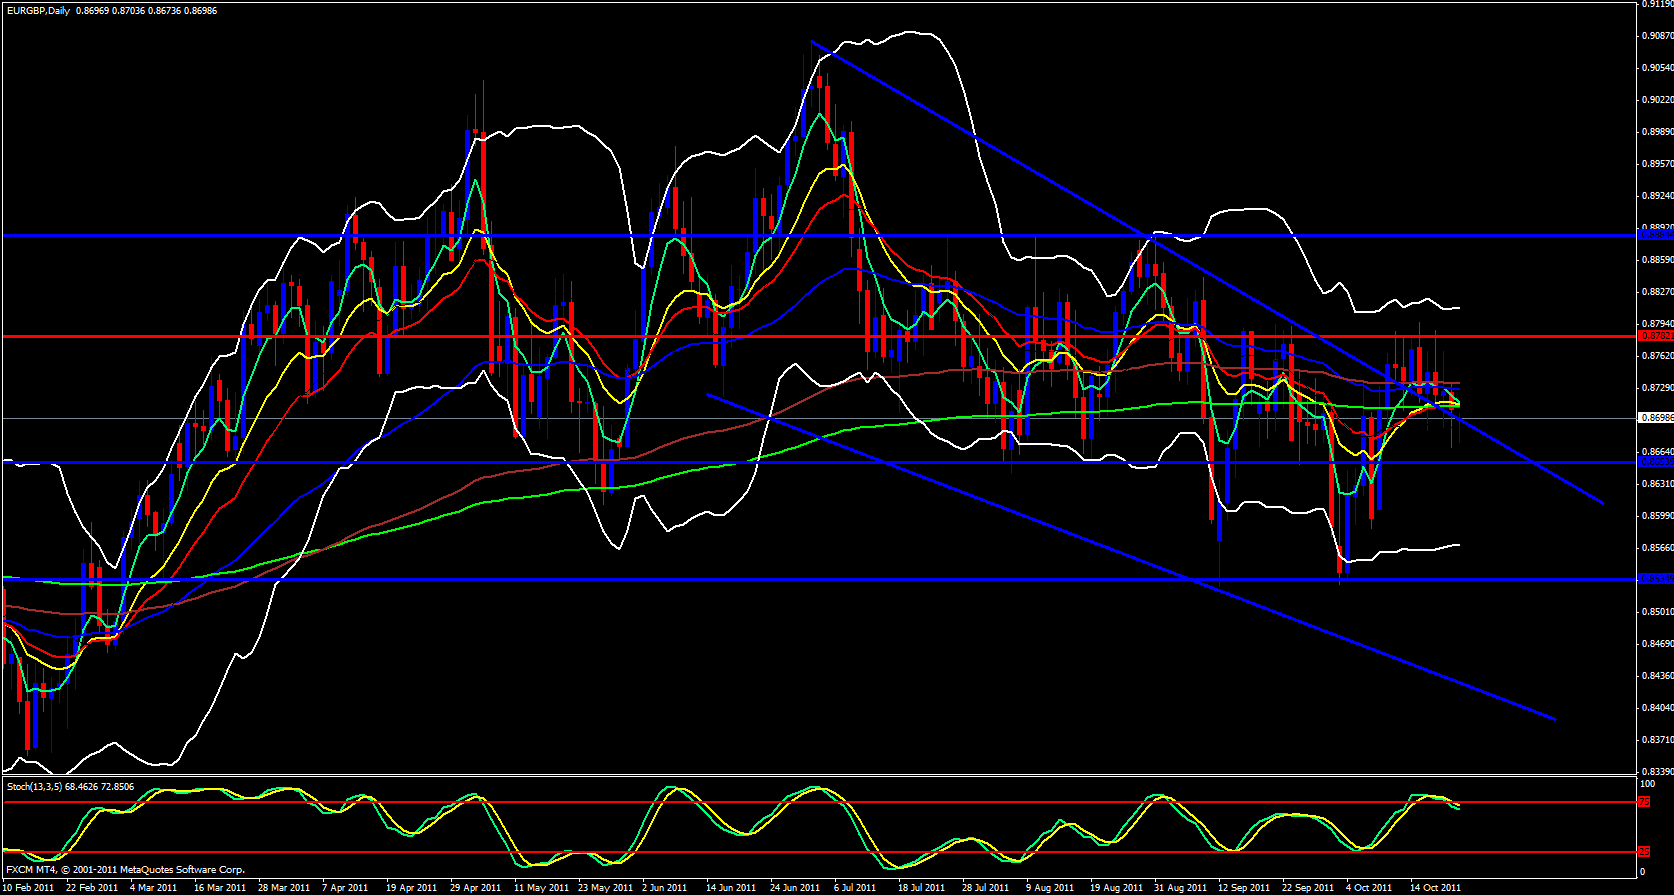
Starting out with the weekly chart for this pair I just wanted to point out a few things. First of all, last week price for this pair had mostly dropped and it pierced the 55 ema and has retested. It is back up against the descending trend line and the 13 ema with the 21 just above the 13. The weekly 21 and 13 ema combined with the trend line should make strong resistance. Moving down to the daily chart I see that the 5 ema is attempting to cross the 233, 21 and 13 ema's. There is a lot of resistance up above, so shorts from this level only seems logical. By the way, I did not mention anything about the EUR/CHF or the GBP/CHF since today it is irrelevant. Both pairs seem to be rather strong against the CHF, however, the EUR/CHF is approaching resistance on the hourly and 15 minute charts and the GBP/CHF is also approaching the same type of resistance as well. Since both pairs look similar then I can only judge the EUR/GBP by its very own price action.
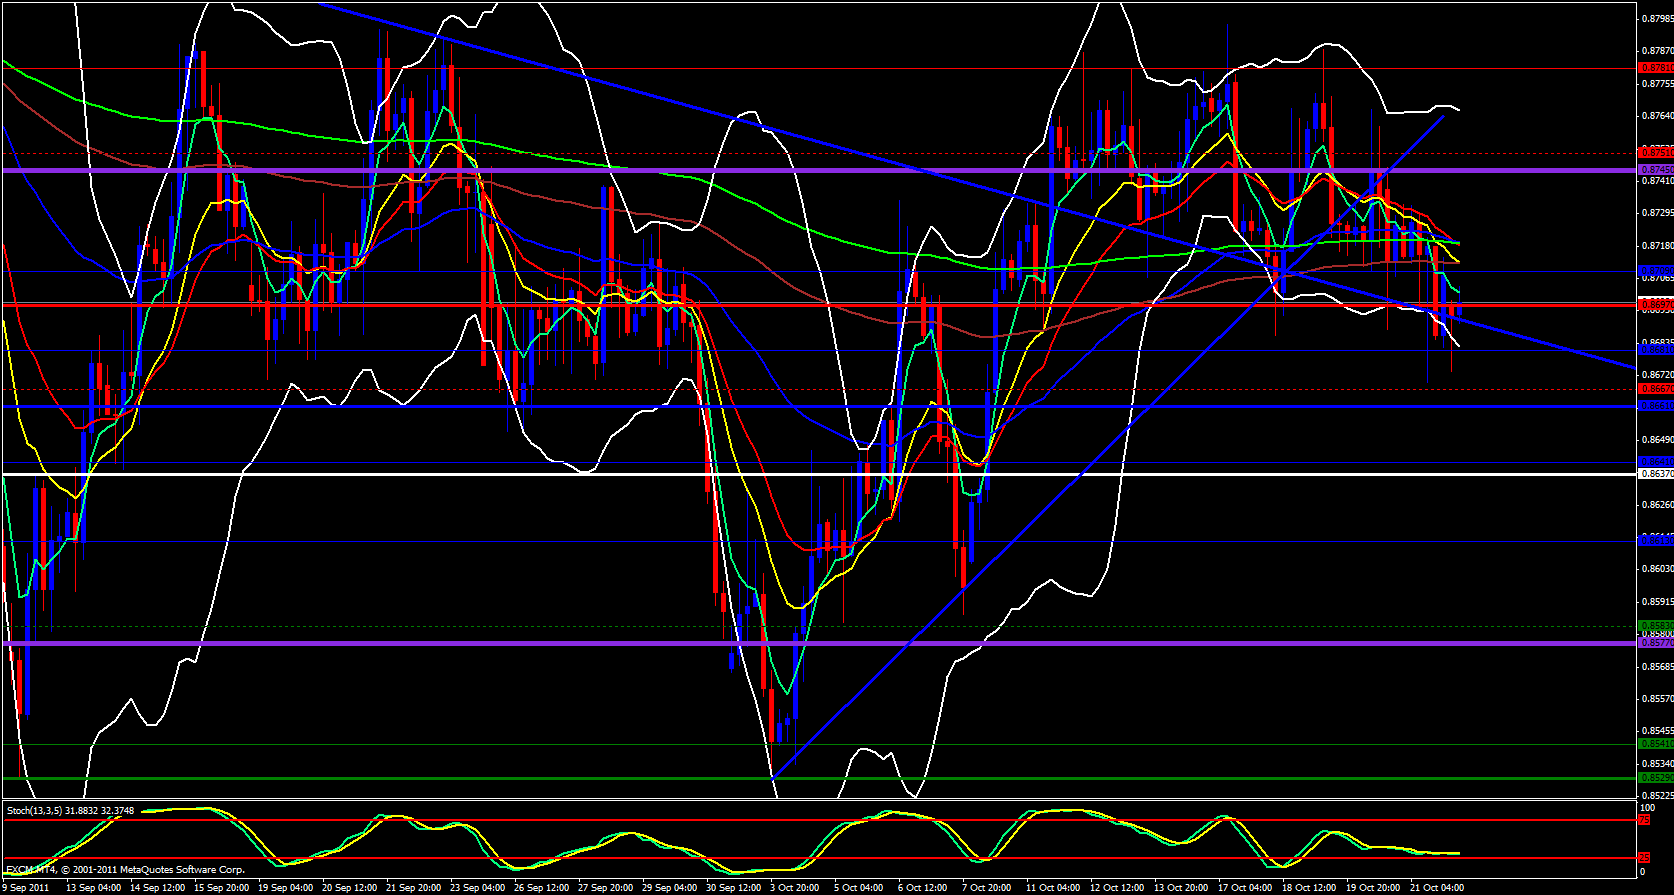
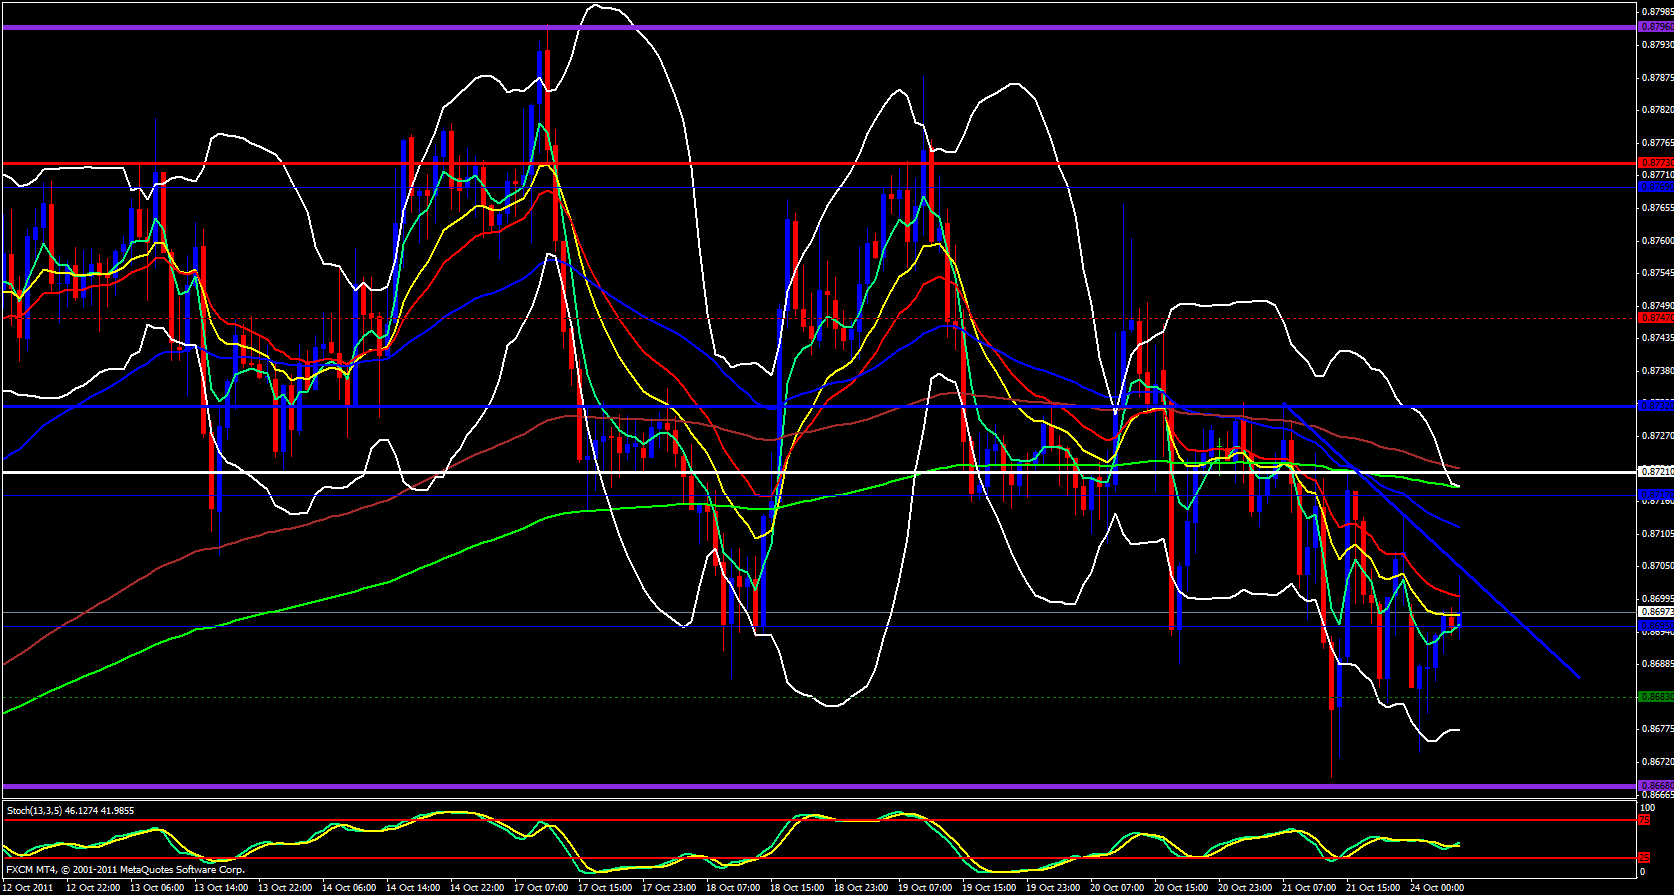
Looking at the 4 hour chart we are riding below the 5 ema. Looking at the 1 hour chart price has tapped the descending trend line 3 times and nearly a fourth time. Price keeps piercing the hourly 21 ema then gets rejected. This is very bearish price action. Finally, I look at my 15 minute chart and I see a consistent series of lower highs and lower lows with stochastic in the overbought zone. Based on what I observe at this time, I am bearish on this pair.


