By: Doug Rosen
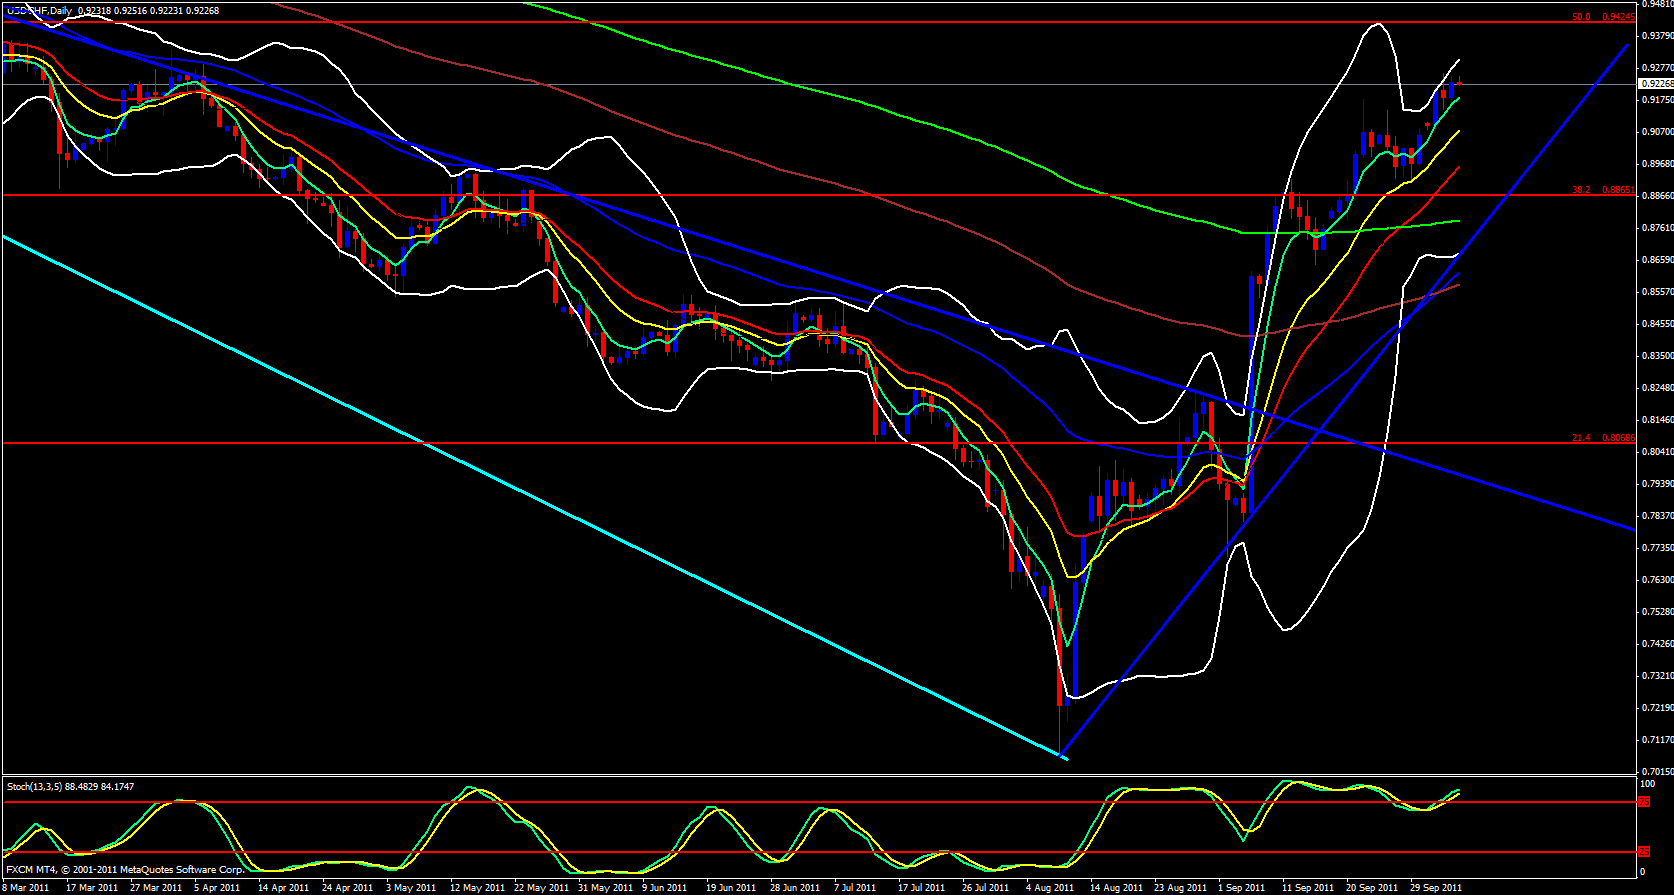
Observing this pair, it is obviously very bullish. Upper Bollinger band is wide open pointing up on the weekly chart, price is riding the 5 ema and has broken the 55 ema, however, we are approaching the 50.0 fib level of the recent move down and the stochastics is in the overbought zone.
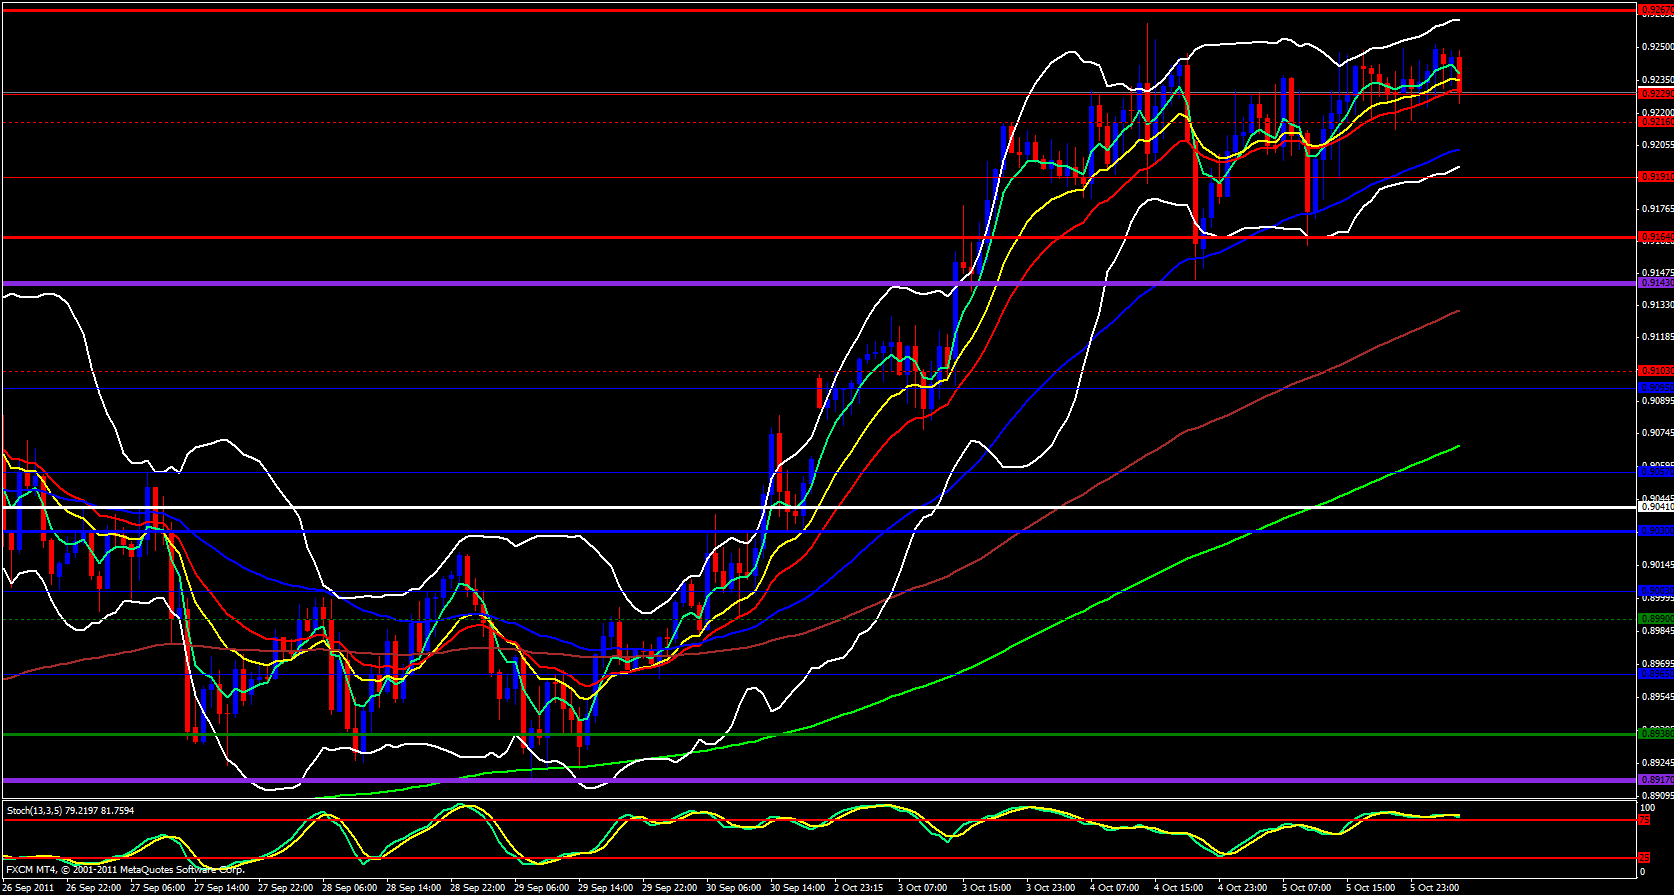
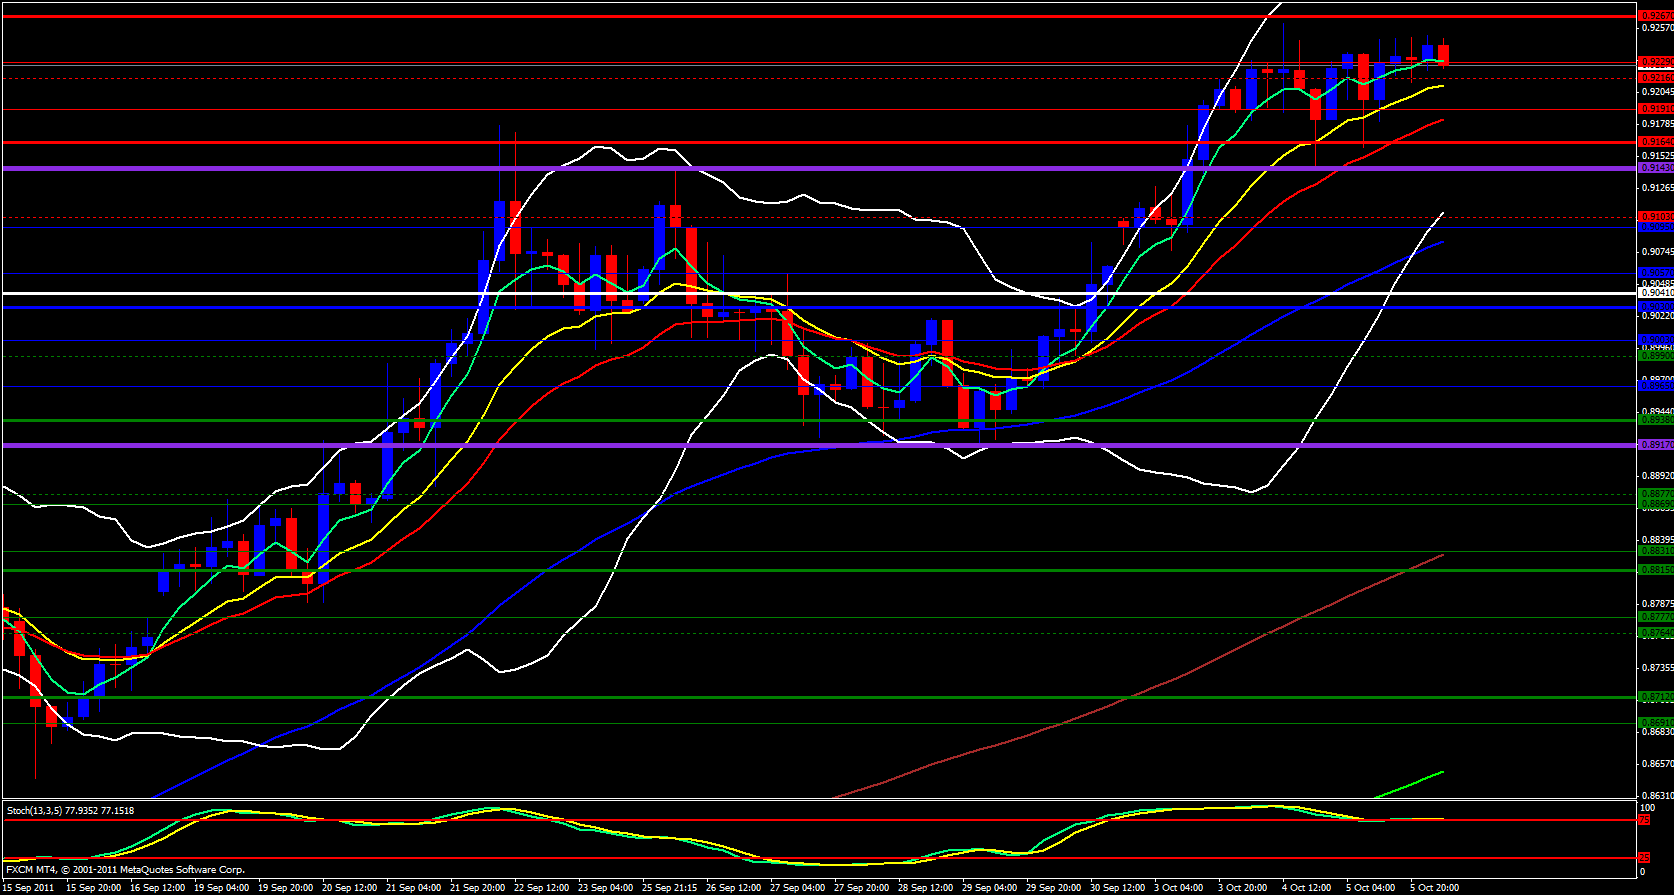
On the daily chart we are gracefully riding the 5 ema up and this Bollinger band is also open and pointing up, however, stochastics is in the overbought zone. Moving over tot he 4 hour chart I see that the 5 and 13 ema's are losing their angle and separation annd the 5 ema appears to be rolling over a bit, maybe this pairs momentum is exhausting a bit since it has approached the monthly and weekly R2.
According to the hourly chart the 5 ema is rolling over and the hourly stochastics is also in the oversold zone yet the 21 ema is still in control and stepping in when he 13 ema is pierced. Finally, on the 15 minute chart price appears to be range bound and is respecting yesterdays high.

Basically what all this means is that the USD/CHF is still bullish but has slowed down a bit. On the weekly chart price has gapped a ways from the 5 ema as well as on the daily so this reflects on the 15 minute chart in the way of a range bound market, giving the ema's a chance to catch up on the weekly and daily, on the 15 minute we are waiting say for the 233 to catch up a bit then price should continue onward to the upside.


