By: Doug Rosen
See how this GBP/USD technical analysis was implemented on a binary actions platform.
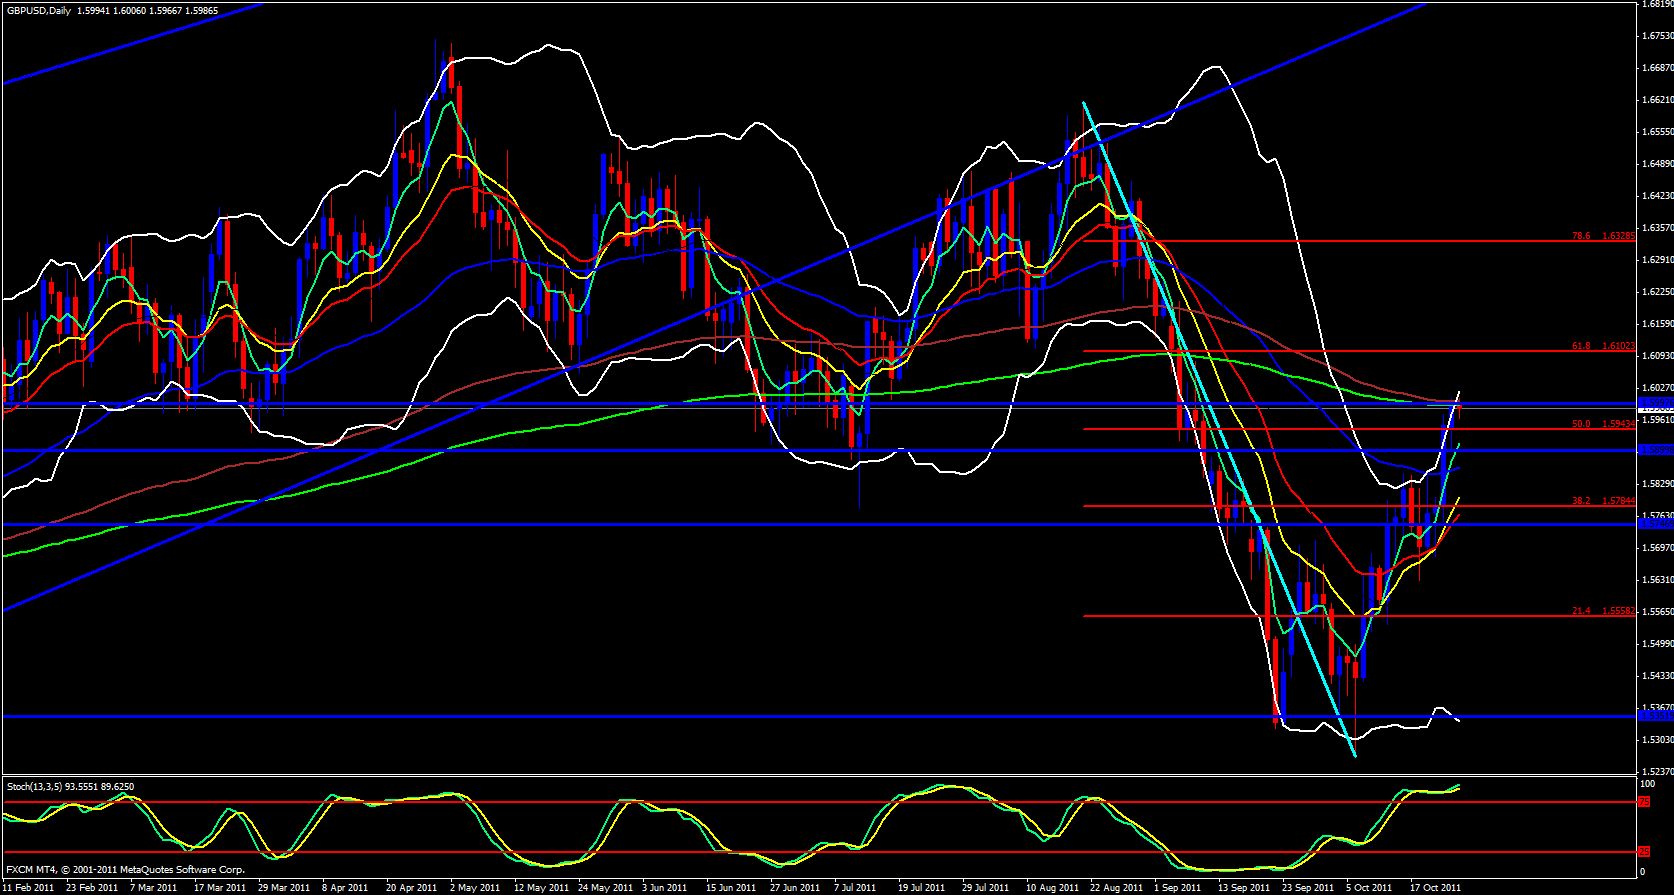
This pair has been looking tricky to me. I am watching this pair very closely. On the daily chart we keep rising, however, we are re-approaching the price channel we recently broke out of which also coincides with a 61.8 fib zone. Price is also up against a 233 and 144 ema's and the stochastic is in the overbought zone. This is all bearish indeed, however, the daily Bollinger Band is wide open and pointing up. Price has been very gracefully riding along the 5 ema.
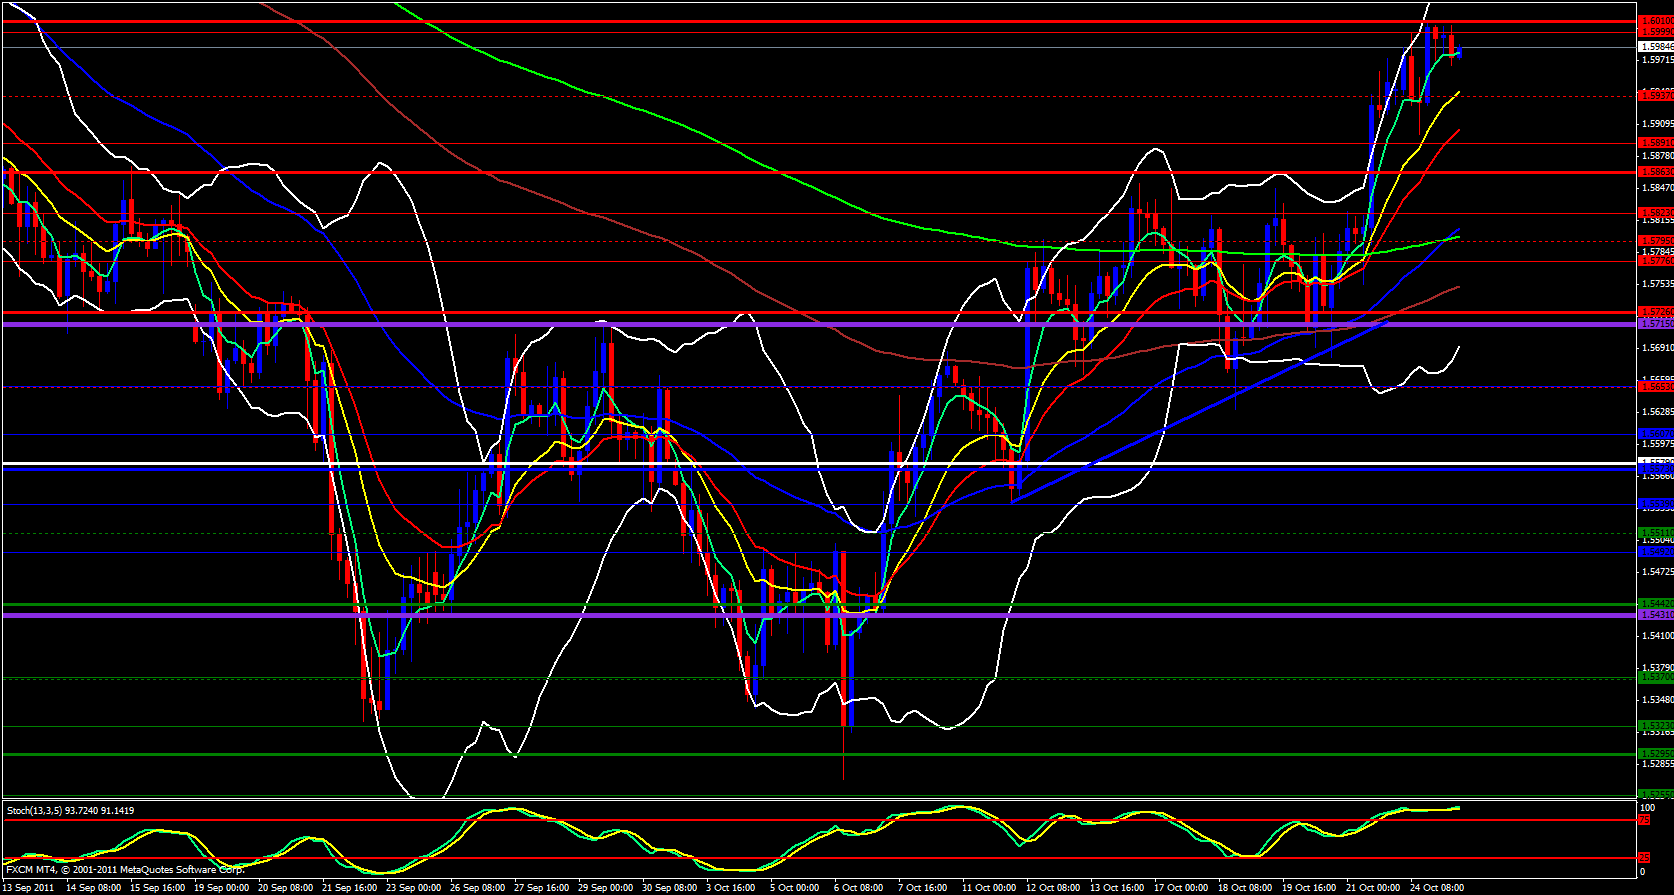
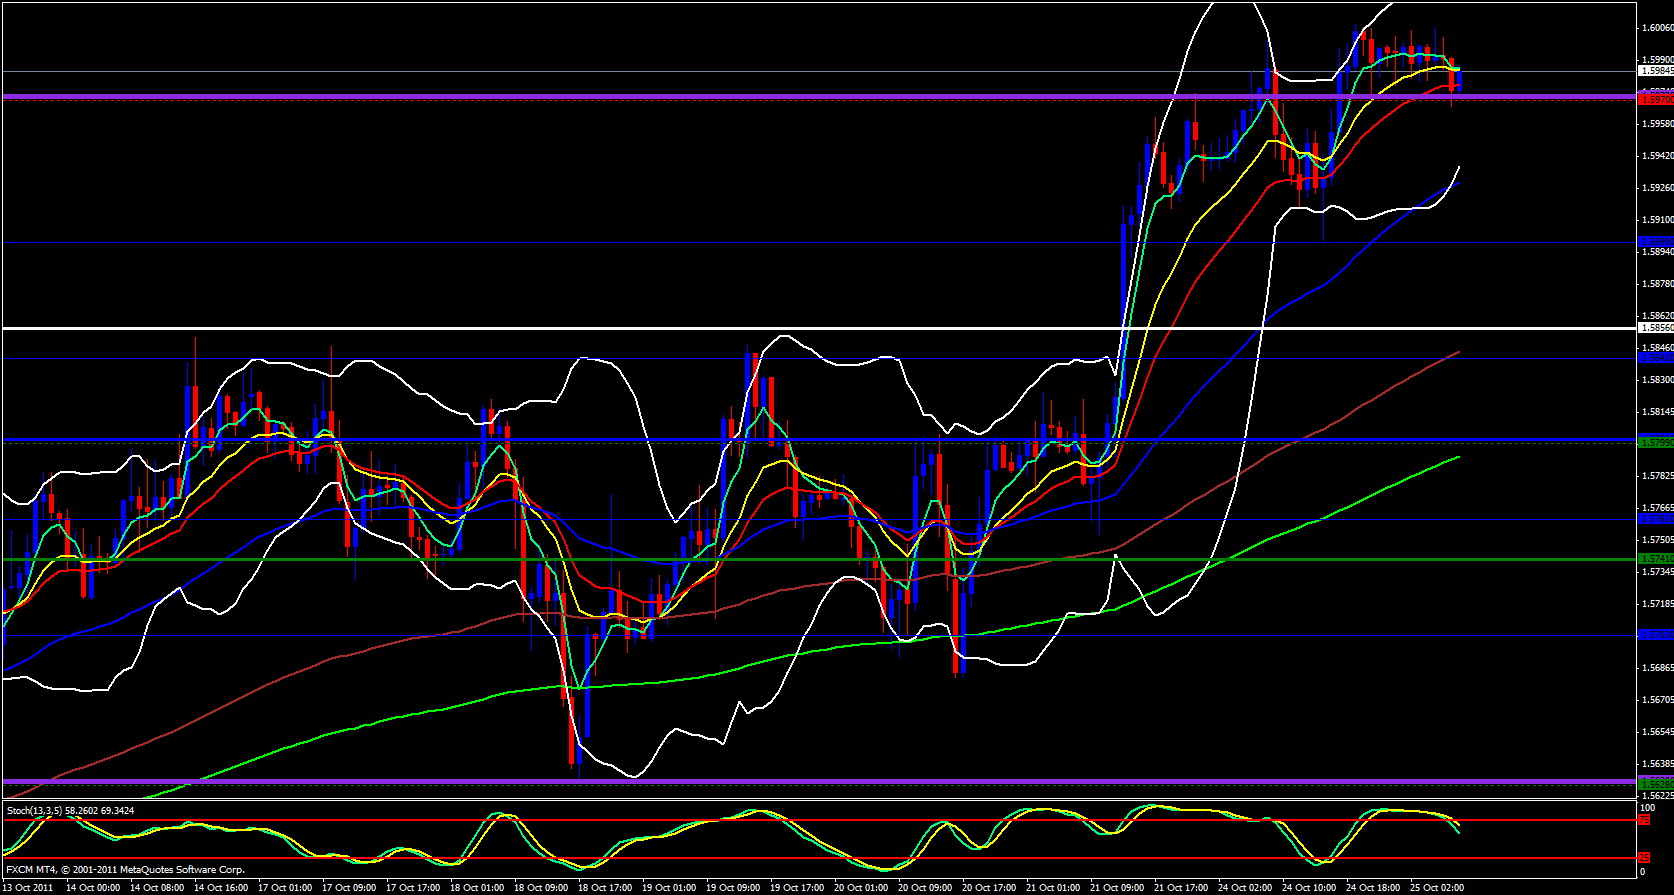
Moving over to the 4 hour chart as well as my monthly pivots I can see that we recently touched the monthly R3 and was rejected, however, on the hourly chart which is also my weekly pivot chart I can see we have busted through last week's high, however, Stochastics is pointing down and the upper Bollinger band appears to be closed. Finally, on the 15 minute chart I see that price is above the daily central pivot point and has just bounced off of it.
The 15 minute stochastic is in the oversold zone. I will be watching for a break above 1.6010 to consider longs for this pair and a break and retest below 1.5965 to consider a short.


