By: Doug Rosen
This pair maintains bullish. Starting with the weekly the price seems to be riding the 5 ema and the 5 ema has crossed above the 13 and 21 and the upper Bollinger band is open and pointing up giving price permission to continue upward. Price has also busted the 55 ema. On the other hand stochastics is in the overbought zone and price is between the 38.2 and 50.0 fib levels of the recent move down which can be viewed by many traders as bearish.
Moving to the daily chart price is riding the 5 ema but yesterday was a down day for this pair and the upper Bollinger Band is pointing sharply down and the stochastics is in the overbought zone. We are however getting ema crossovers to the upside and the angle and separation between the ema's is wide so speed and momentum is still very strong. Retracement is still possible however. Price is above the monthly R2 as well as the weekly central pivot point but below the daily central pivot point. Looking at the 4 hour chart it is obvious that price has been falling a bit and the 5 and 13 ema's are braiding but price is just above the 21 ema, the lower Bollinger band appears to be dynamic support. Stochastics is also in the oversold zone. Moving over to the hourly chart price appears to be riding the 21 ema down and the 21 has crossed below the 55 which means the market could be changing to the down side. Ema's are braiding which means no real speed or momentum and the hourly Bollinger bands are closing in. Price could fall down to the weekly central pivot which by that time will overlap with the hourly 144 at around 0.8996 then bounce back up and continue bullish.
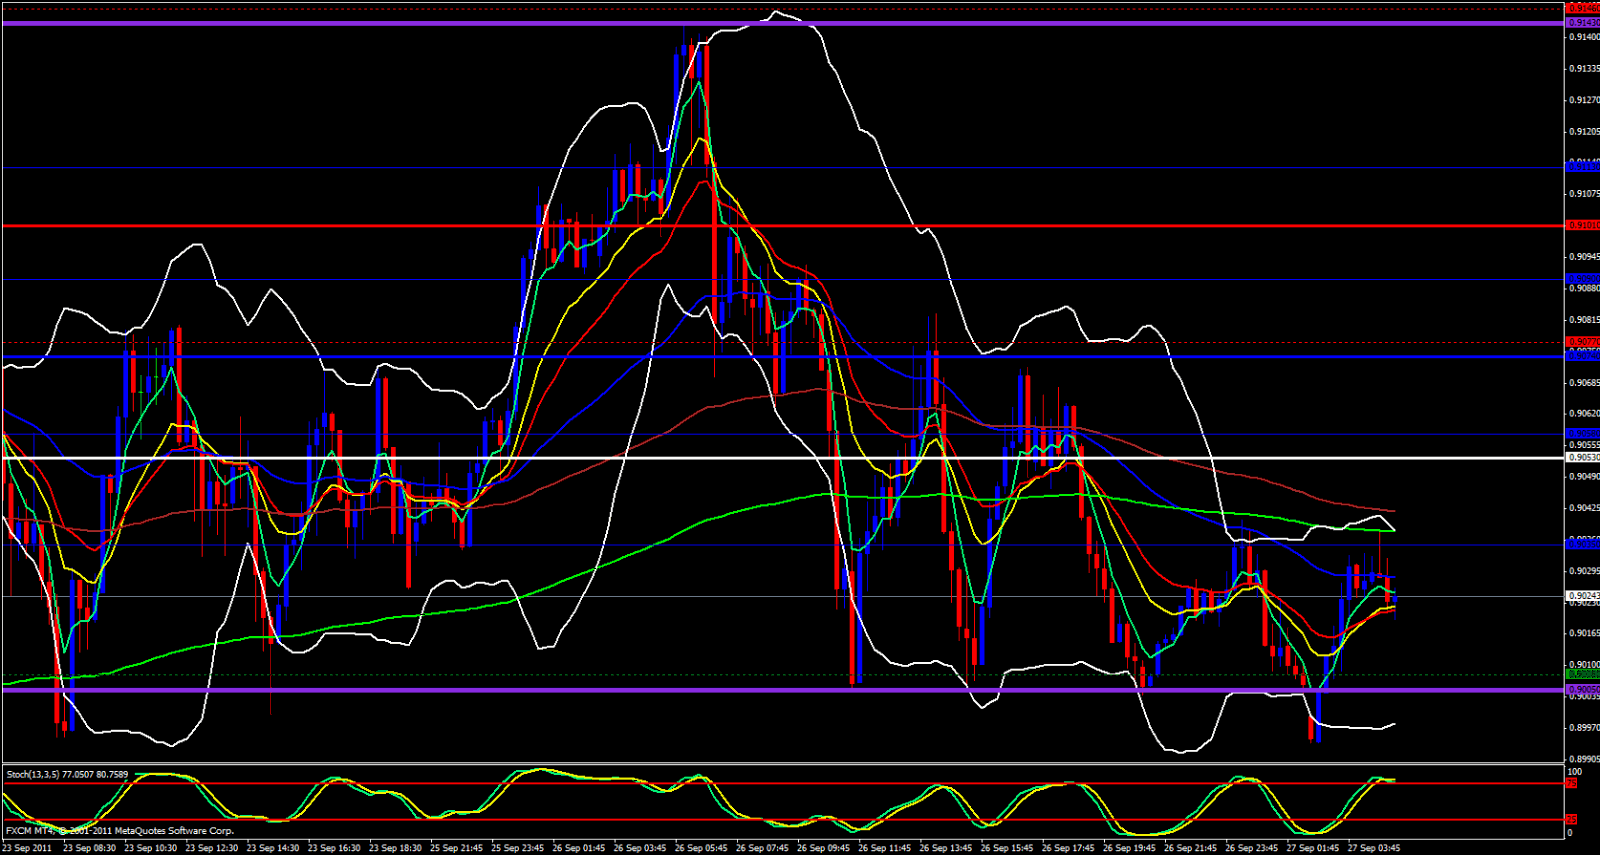
Finally, on the 15 minute chart price is looking bearish. Price has made lower hihs and lower lows but seems to be caught in a range between the daily central pivot point and yesterdays low. Price is below the 233 and 144 ema's, stochastics in the overbought zone and the upper Bollinger band seems to be pointing down. It could be that price will be stuck in a consolidation range and I don't see any trades with this pair at this time. To consider a long I would wait for a break above the daily central pivot then a retest then a sign of green or a short after a break below yesterdays low with a retest then a bit of red or better yet, a break below 0.8968 which will be a break below the weekly central pivot as well as the hourly 144 ema, always wait for the pullback then a sign of red before taking a short.


.gif)
