By: Doug Rosen
Retracements of the previous drop to be expected:
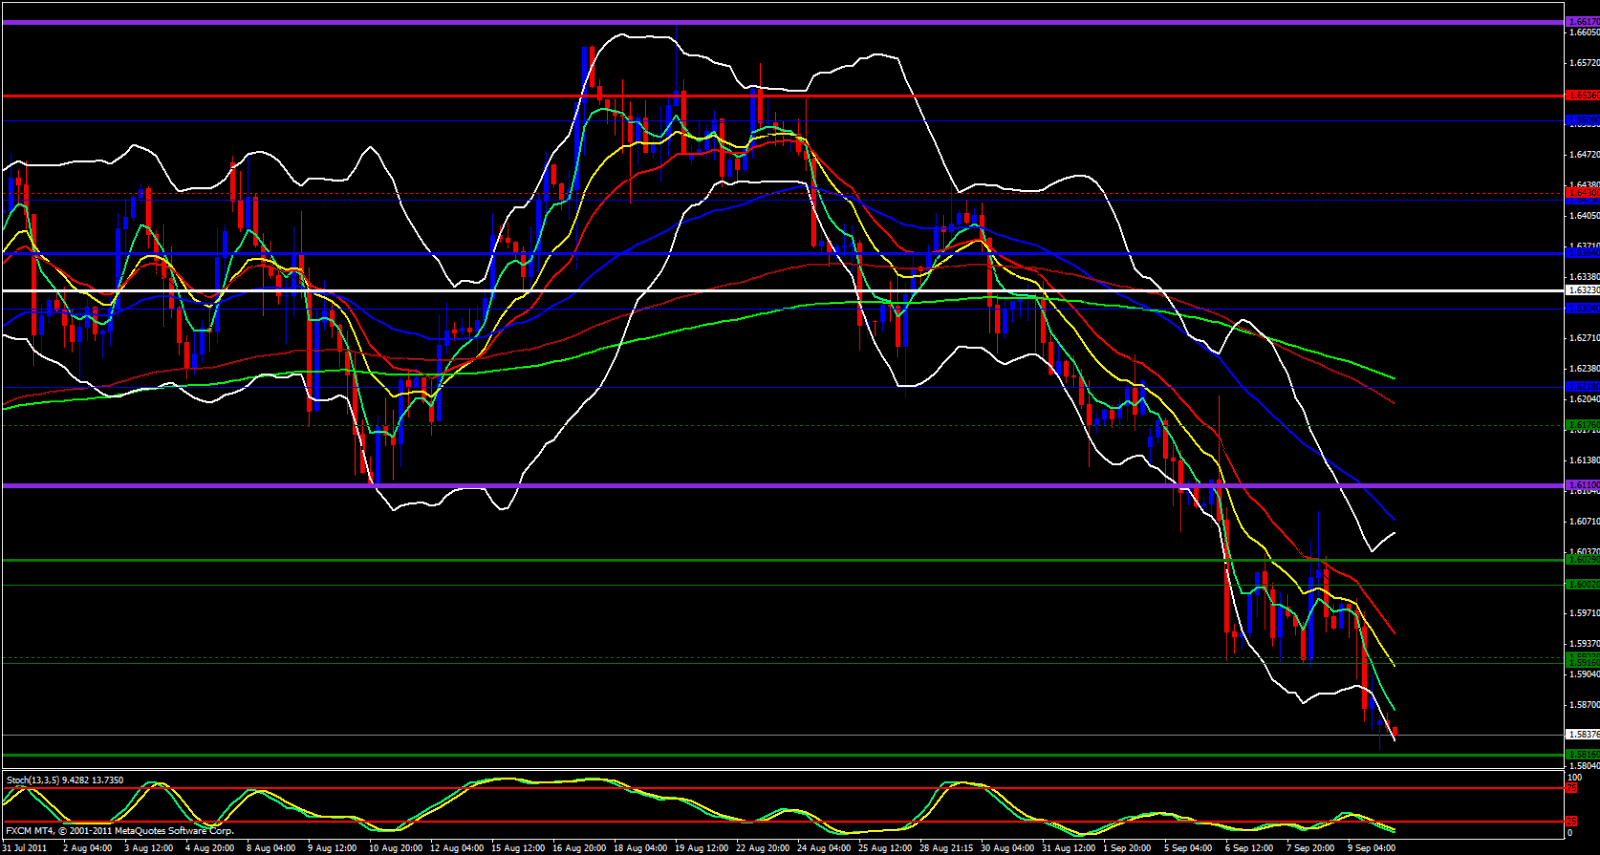
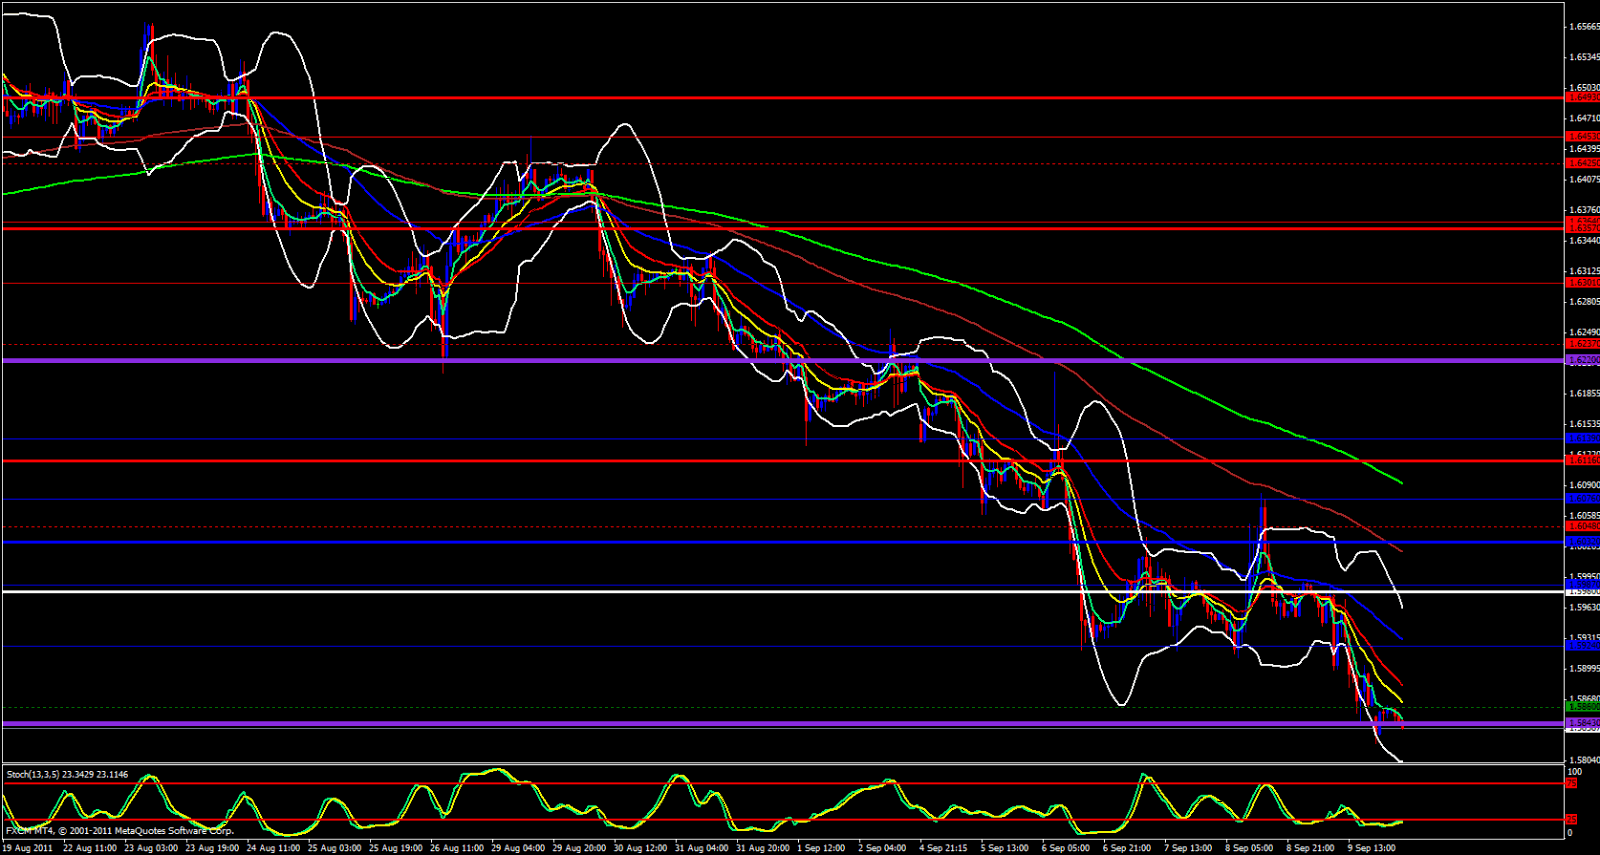
The GBP/USD is quite a distance from its 5 ema and up against the lower Bollinger Band on the Weekly chart, as well as about 40 pips away from the Daily 5 ema, with Stochastics in the over sold zone, just above the Month M2 overlapped with last weeks low as well as Fridays low I cannot help to think this pair is also either in retracement mode or consolidation mode.
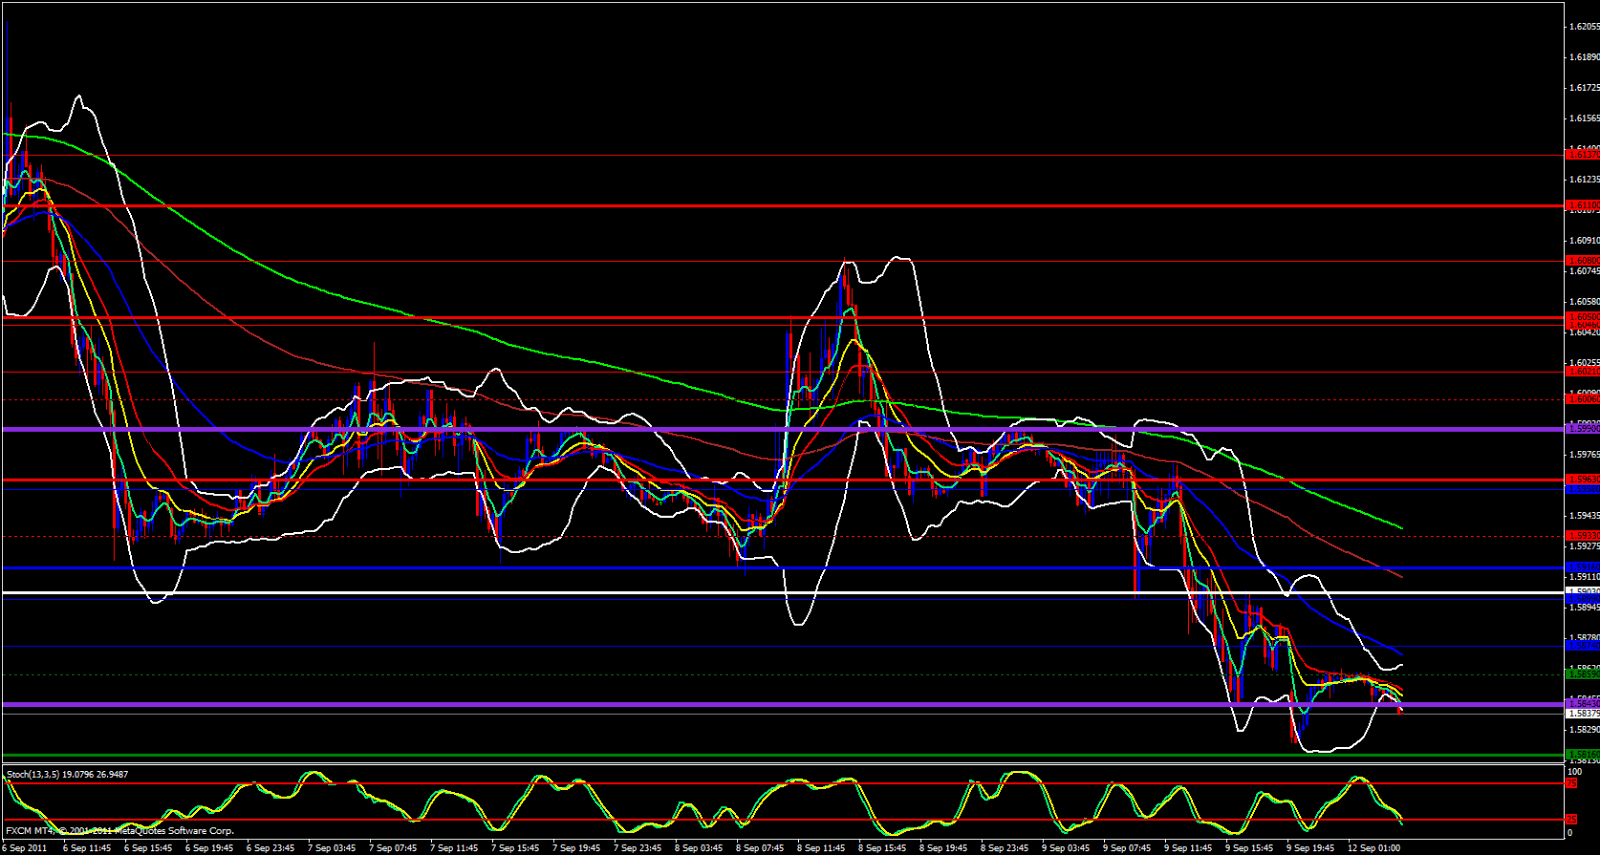
I would be watching for a re-visit to the 1.5900 area before I would expect it to continue downward. Watch for a fight in the 1.5874 area if you are longing your way to 1.5900. If taking a short off of 1.5900 consider a stop at around 1.5920 and set your profit target to around 1.5840.


