By: Doug Rosen
GBP/USD pair continues its heavy dive down. This is caused by an obviously strong USD and is amplified by the fact that the EUR/GBP has been quite bullish causing GBP weakness.

This is the pair to really watch now because the GBP is weak and the USD is strong and in currency trading we always look for opportunities to pair a strong currency with a weak currency but we must always keep in mind the efficiency of the Forex Market and even though the USD may be strong and the GBP may be weak, when price hits extreme levels profit taking kicks in and what may have been a long glorious down trend could abruptly turn into an instant reversal only because limit orders kick in.
I do think we should continue to be bearish on this pair until proven otherwise, we must only consider bearish entry's on reasonable size pullbacks. This pair is approaching visible support within another 100 pips down.

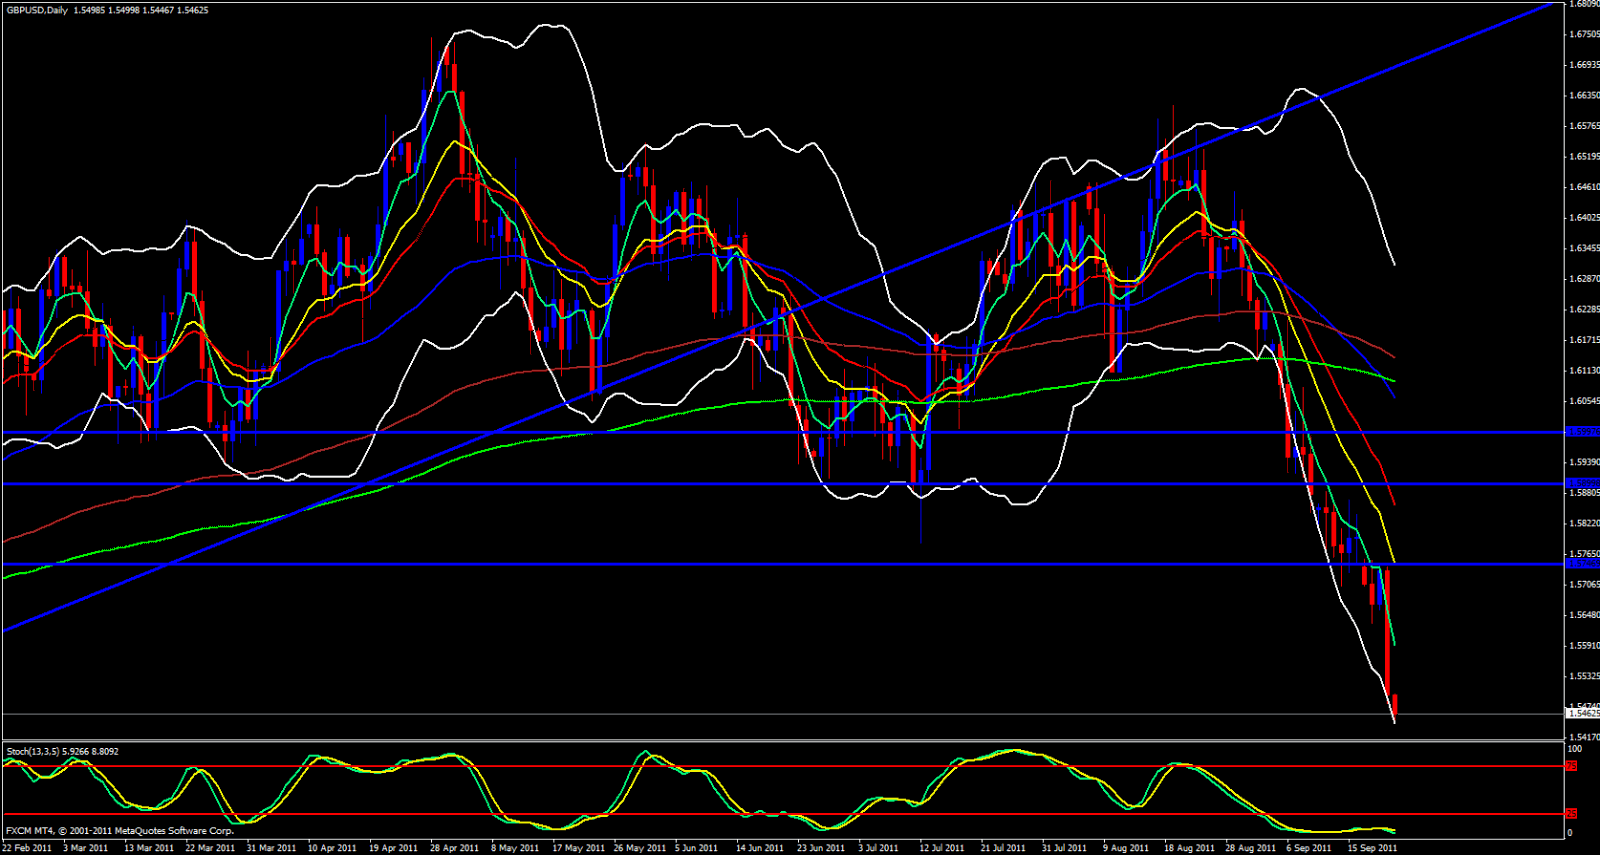
On the weekly chart we are far extended out of the lower Bollinger Band and Stochastics has made its way into the oversold zone. Price is a bit of a distance from the 5 ema.
On the daily chart same deal, stochastics is in the oversold zone, the Bollinger Band is stretched out tot he downside and just like a rubber band will have to snap price back up sooner or later. Price is 120 pips south of the 5 ema and needs to make contact with the 5 ema to continue its move downward. Price is way below the monthly S3 which is the sign of a breakout but I think price needs to come back to the S3 on a retest to continue further downward.
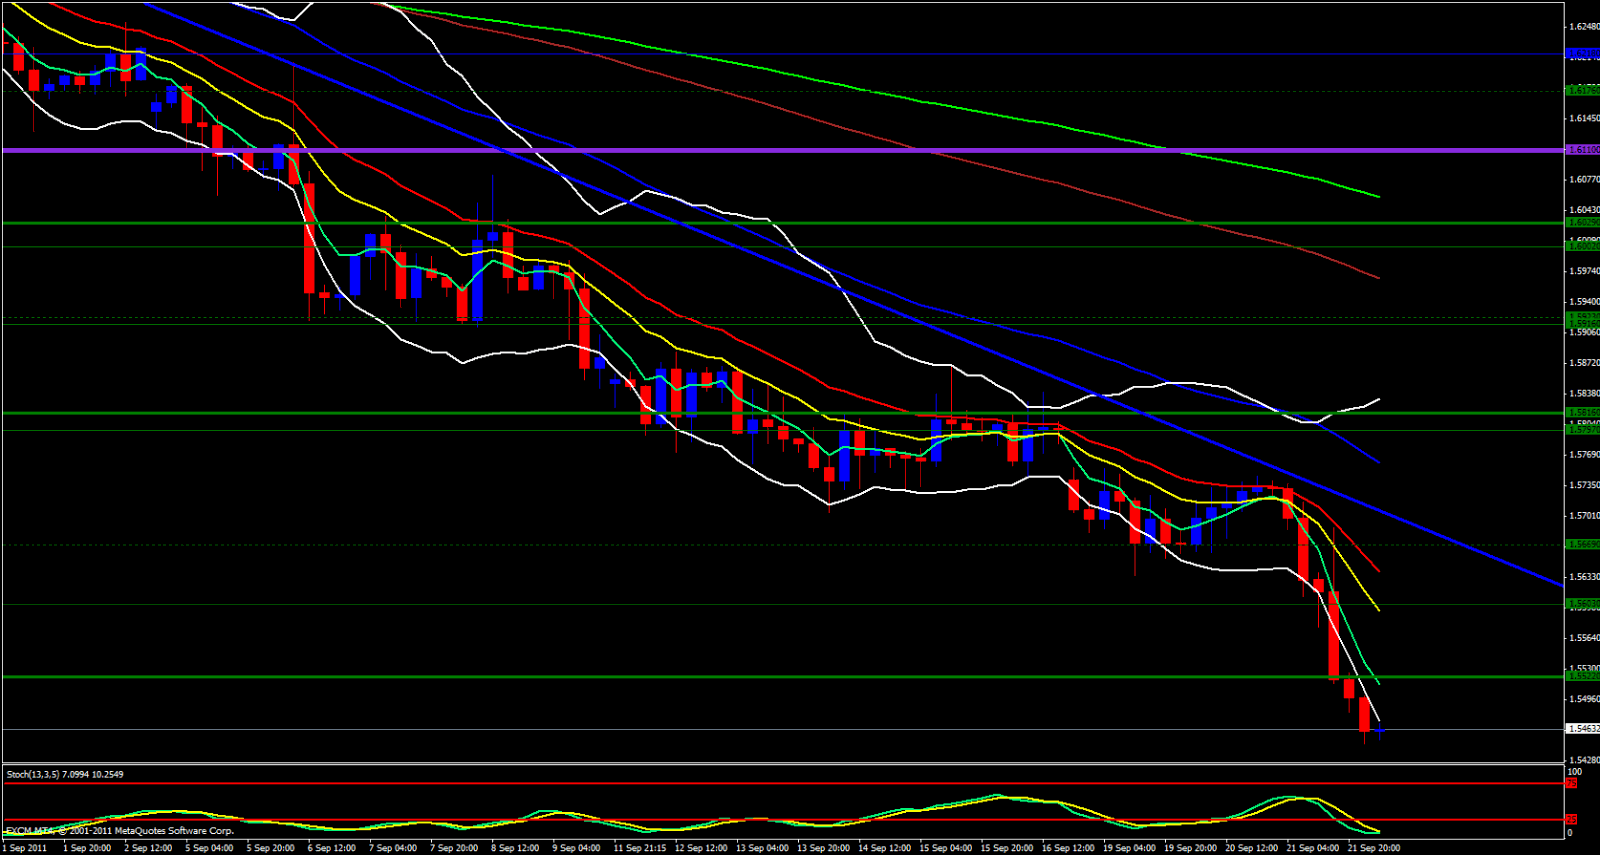
Price has also broken the Weekly S3 Pivot point and is below yesterdays low. If price can make it down to the 1.5400 level I would expect profit taking to kick in causing price to take off to the upside Looking at the 4 hour chart we are below the lower Bollinger Band and the stochastics is oversold.

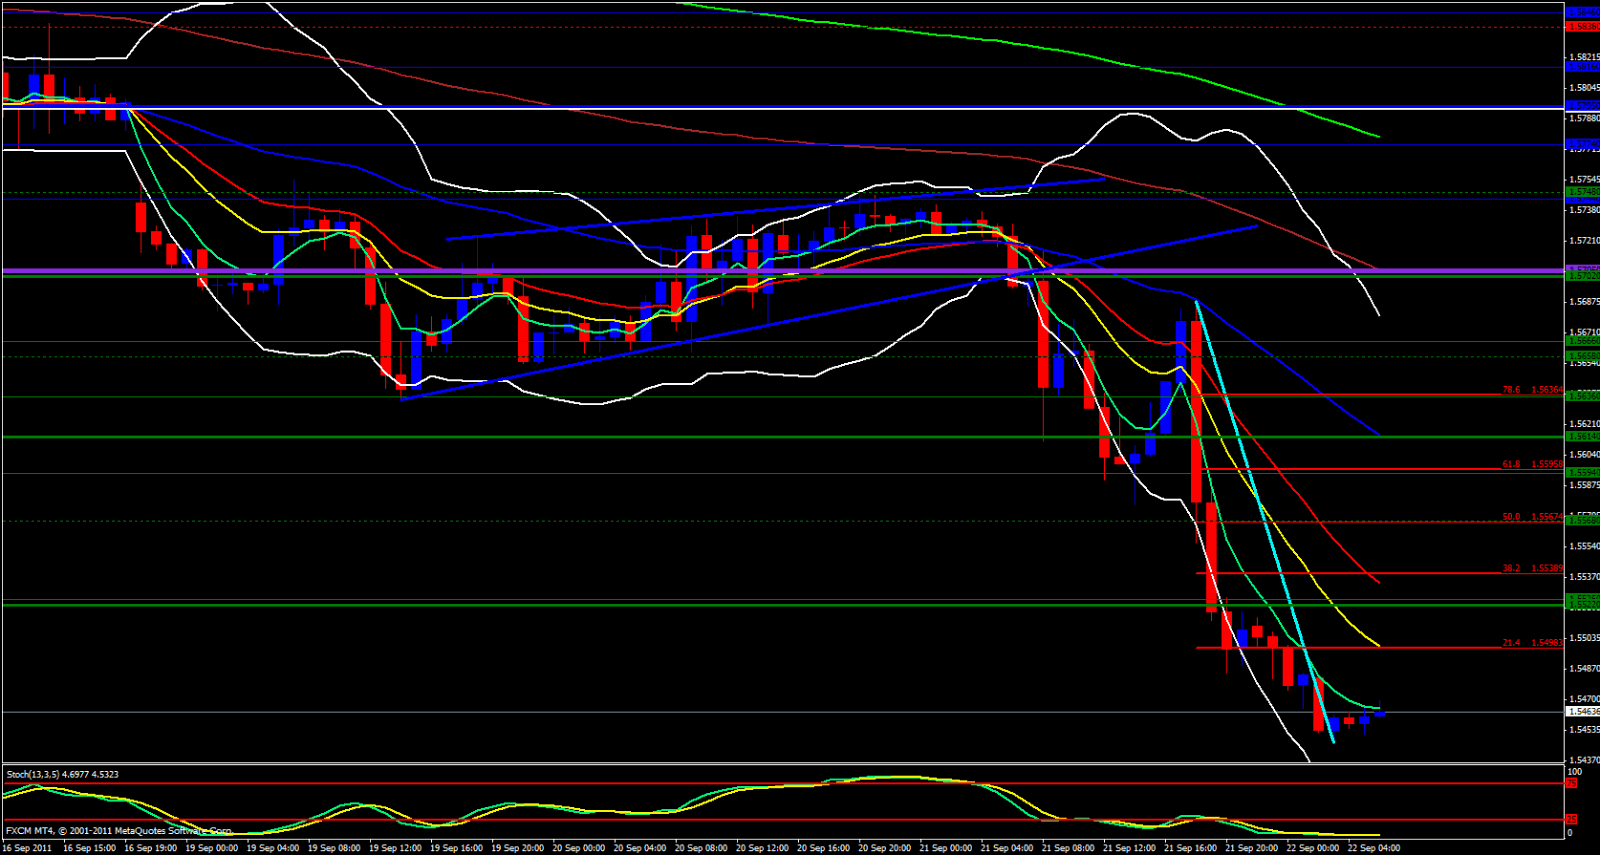
On the 1 hour chart we have been gracefully riding the 5 ema downward with plenty of angle and separation between the ema's on all time frames and the 1 hour stochastic is also oversold.
On the 15 minute chart the 5 ema is beginning to cross the 13 ema but this may just be a minor pullback and I would not read too much into it just yet. I wouldn't consider shorting this pair before it makes its way back to the 1.5540 level. Watch for long opportunities around the 1.5400 level.
See how this market analysis translated into profitable trades here.
