By: Doug Rosen
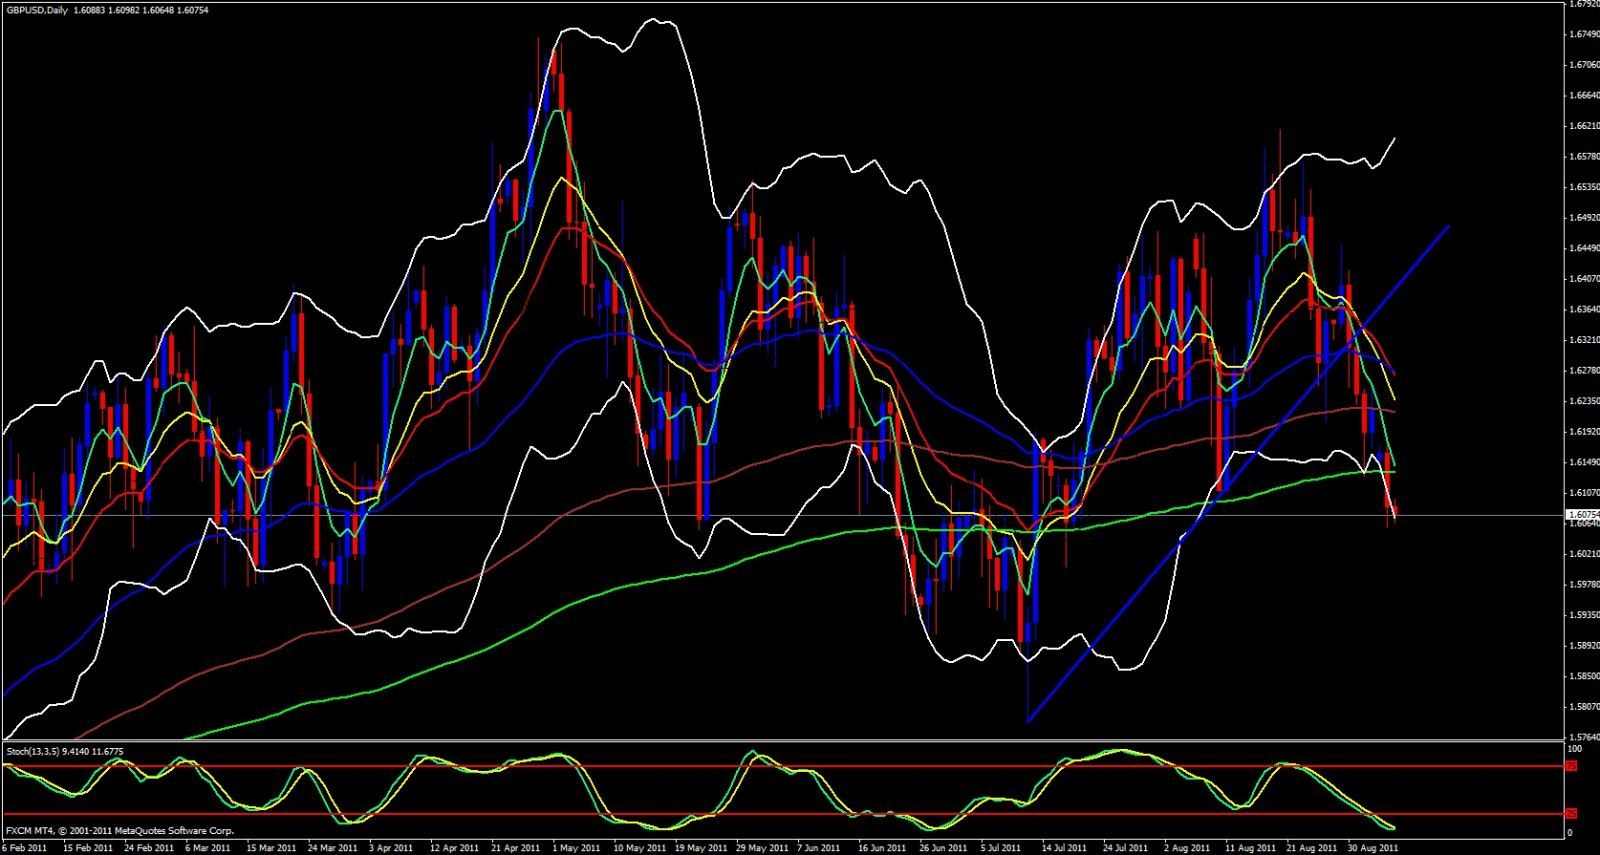
The gbpusd continues to look extremely bearish. On the daily we have open bollinger bands and are still within the bands and we have broken the 233 ema. Stochastics is in the oversold zone and looks like it may even want to make a crossover, and on the weekly we have poked a 55 ema so a slight bounce tot he upside is expected, however, I do not expect a huge bounce up since speed and momentum to he downside looks quite fierce.
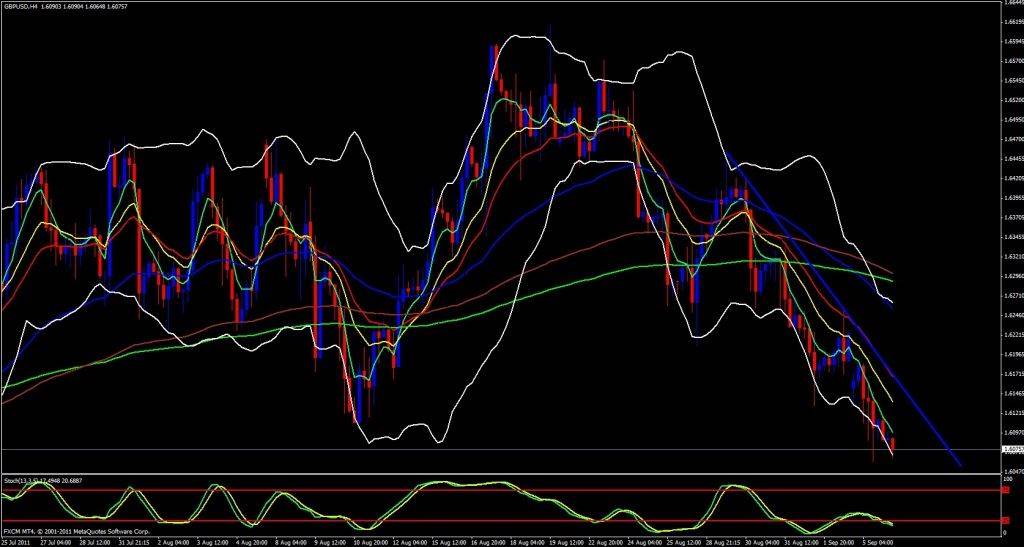
 On the weekly stochastic is in the trade zone and crossing down looking very bearish, on the daily the shorter term ema's are crossing the longer ema's downward, also very bearish, on the 4 hour we have been smoothly coasting along the 5 ema and still within the bollinger bands. On the hourly same situation. All time frames seem to agree bearish with each other, even the 15 Minute. Price with this pair is just below last months low which overlaps with the 4 hour 13 ema. If we were to go up before continuing down I don't expect to go up very far. I would expect to enjoy continued downtrend with this pair and would not expect a pullback tot he upside much higher than 1.6110 if any pullback at all.
I think the next area we can expect a bounce to get into a position would be around 1.6060 and this bounce should take us back up to 1.6080 at which point we should bve able to get into a short position and enjoy the ride down. I think if you were to enter a short at 1.6080 you may be able to set a very tight stop loss, probably not more than 12 - 15 Pips above your entry.

