By: Doug Rosen
Today the EUR/USD looks very similar to how it looked yesterday. At the time I amm writing up this analysis the daily candle is red and below the 233 ema with the 5 crossing sharply downward and poised to cross through the 233 ema. What cannot be ignored is that price is just above what has been a very strong line of support at the very powerful psychological level of 1.4 going all the way back to March of this year.

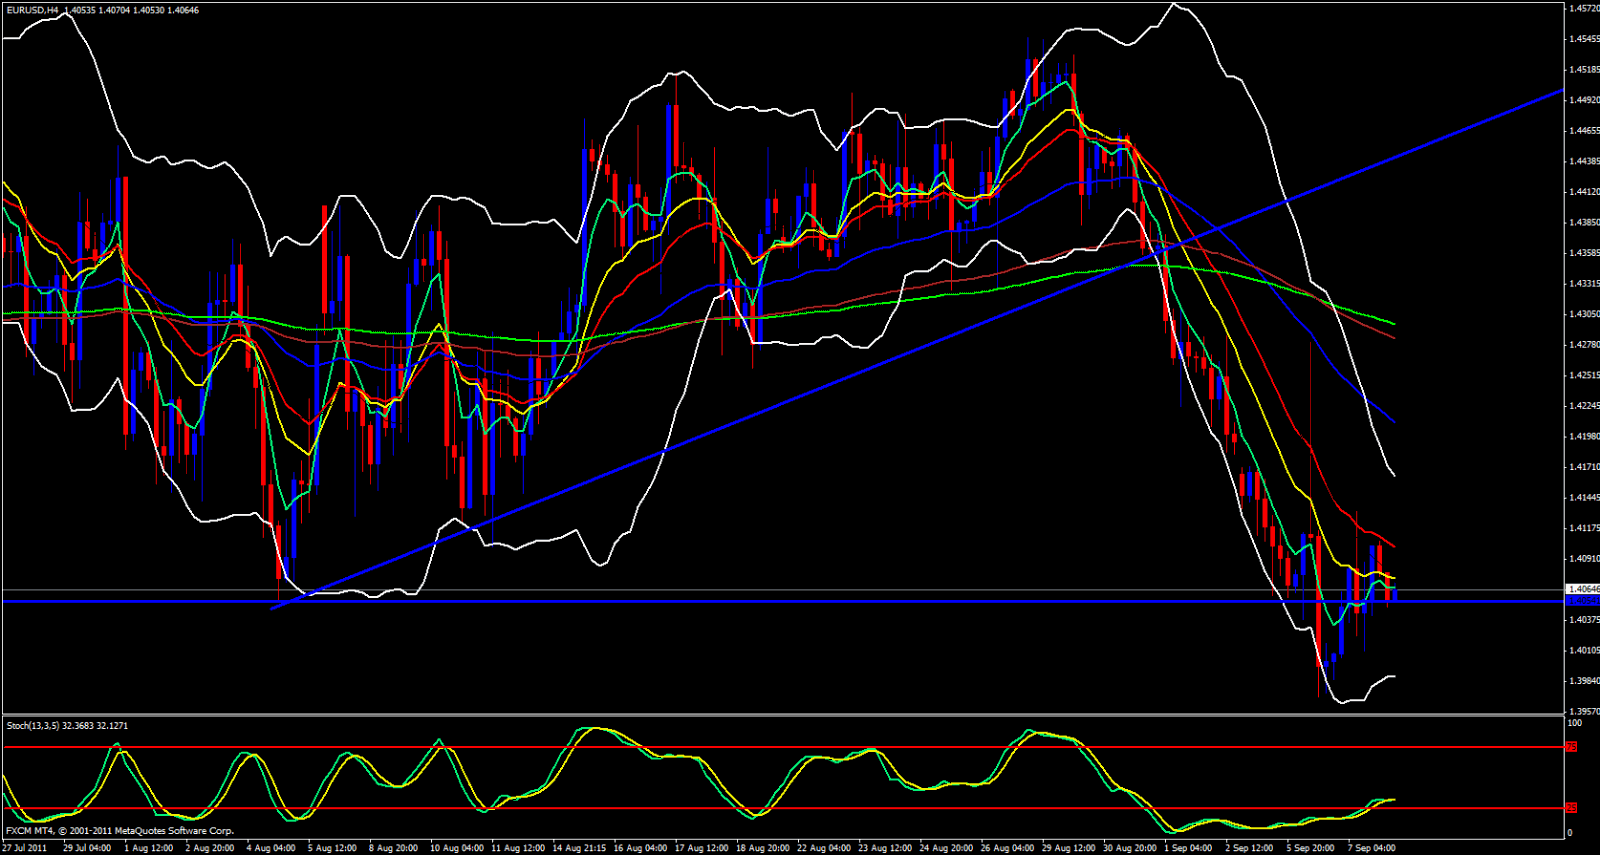
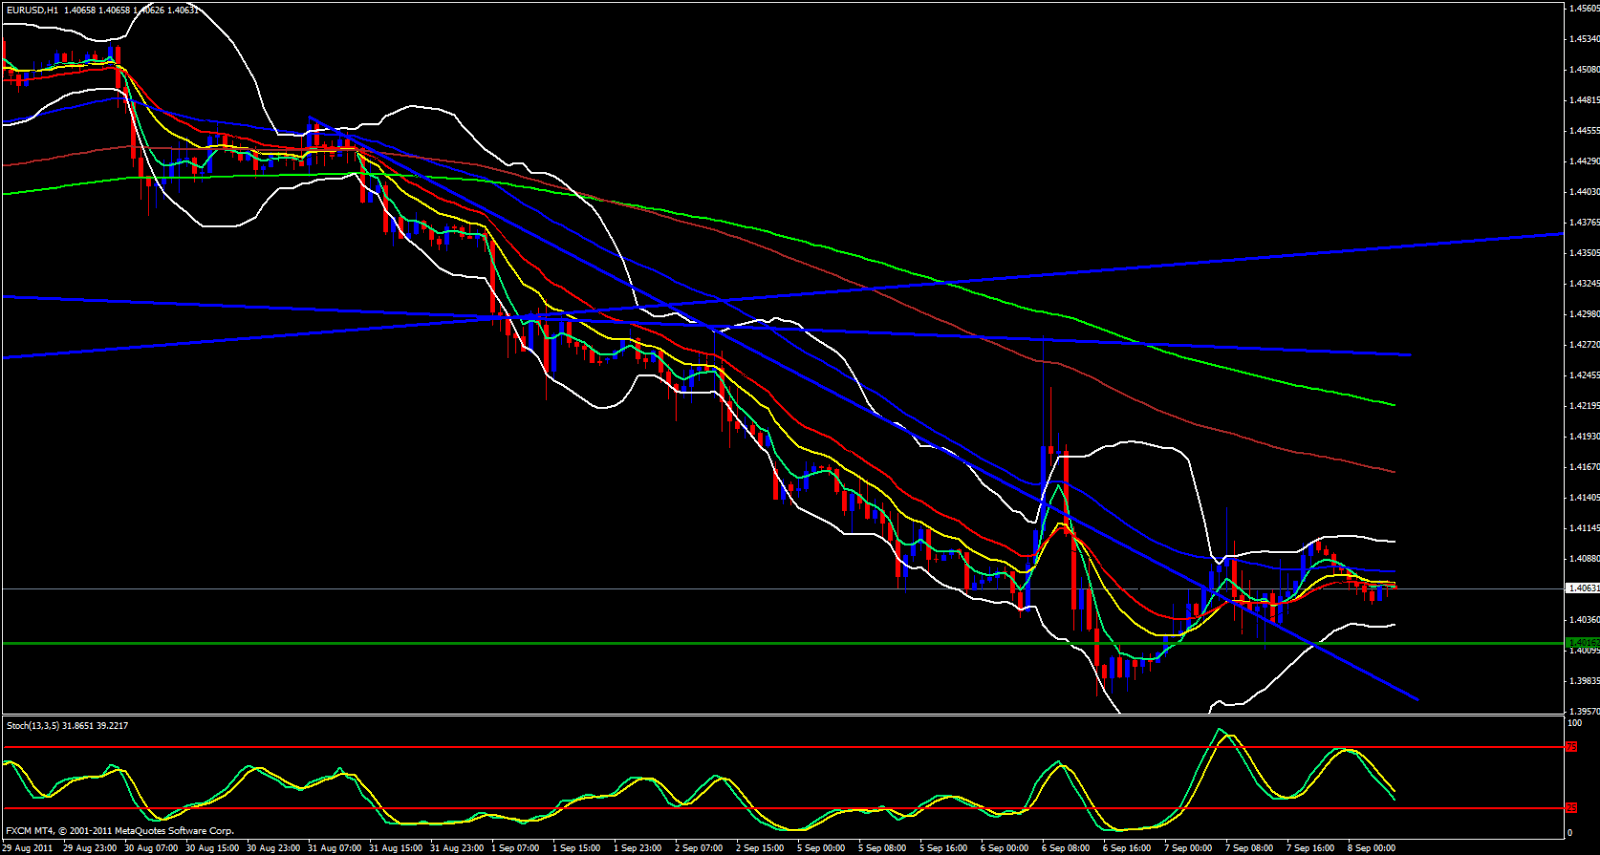
This area appears to be a very tough nut to crack. Taking a quick peak at the weekly we are sitting up against an ascending trend line and bouncing off the lower Bollinger Band. On the 4 hour the 5 ema is just below the 13 ema pointing downward trying to force price downward. Moving along to the 1 Hour chart the 5 ema has crossed through all the 55, 21 and 13 ema's but the upper and lower Bollinger Bands are pointing straight, looks like continued consolidation.
Regardless, my bias for this pair is still bearish. We are firmly sitting on the August low with pressure pushing price down. Something has gotta give. We are just below the Weekly S1 Pivot and below todays Central Daily Pivot, continuing to make lower lows and lower highs so I do expect this pair to continue to travel downward.

There will be a lot of news today so I expect most of the volatility for this pair to evolve during early NY. If price breaks below 1.4044 expect a pullback at around 1.4025 then take your short off a fib and look to go short until 1.4010 at which point I will expect a bounce to the upside. If price continues downward expect a bounce at 1.3990 then look to enter another short around 1.4010 and look for it to go to 1.3965 then expect another bounce back up.