By: Doug Rosen
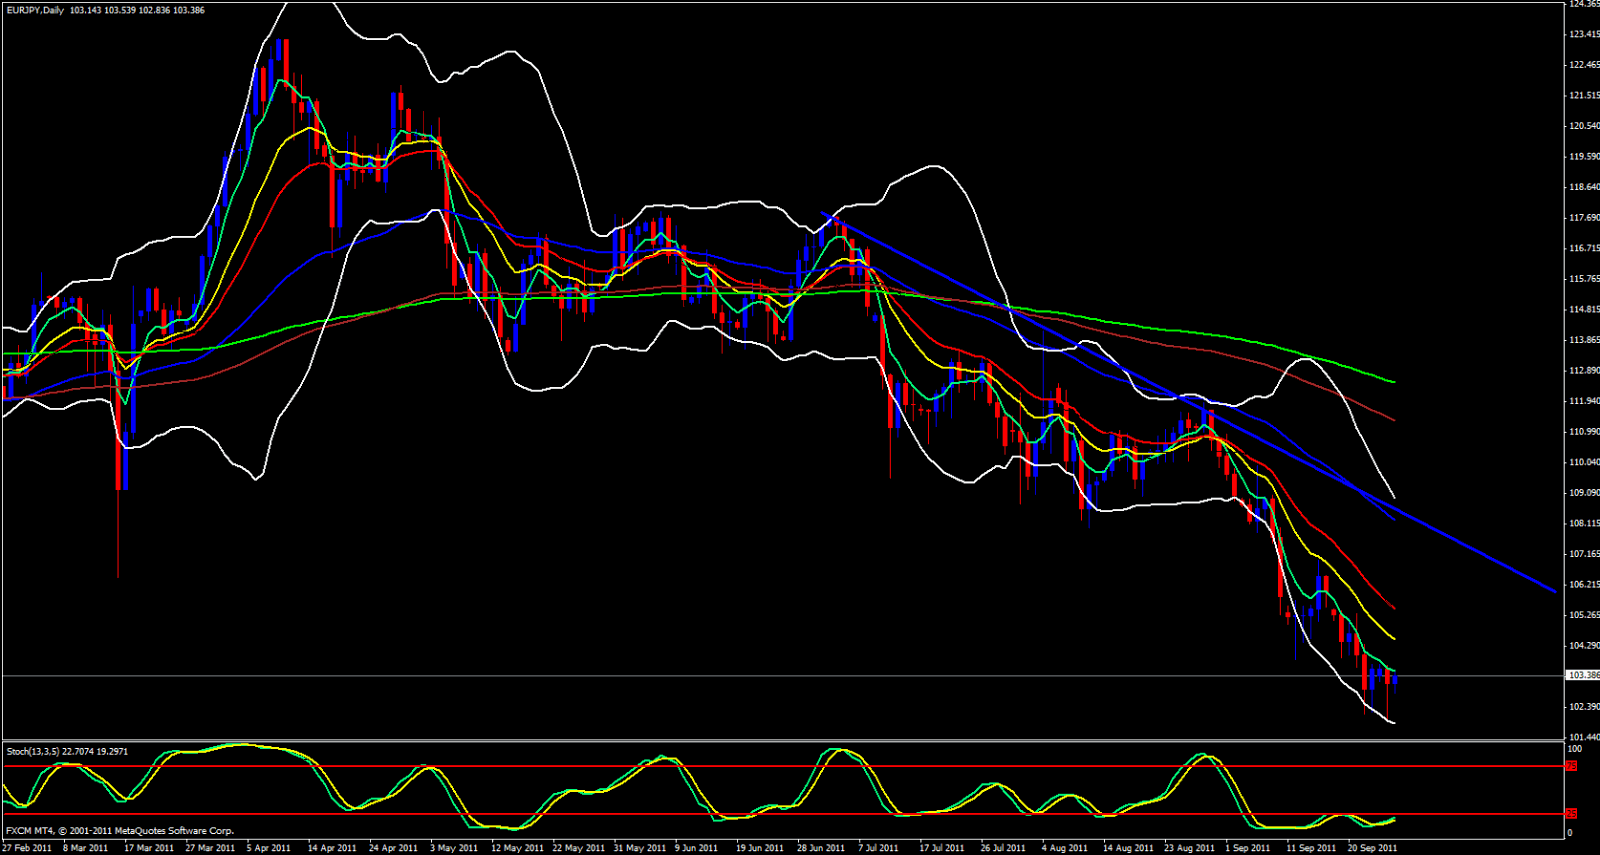
I am going to skip the weekly with this pair since it doesn't really tell me much and go straight to the daily. This pair continues to look bearish, yesterday the daily candle bounced off the lower Bollinger band, moved up to the daily 5 then was pushed back down just a bit and closed red. The daily candle is currently up against the 5 ema and the 13 and 21 appear to point sharply down with great angle and separation. Price is just a bit above the monthly M0 Pivot Point and below the weekly central pivot point and just below the daily M3. These are all bearish indications. Price is up against the 4 hour 21 ema and the upper Bollinger band is pointing down and closing in on price.
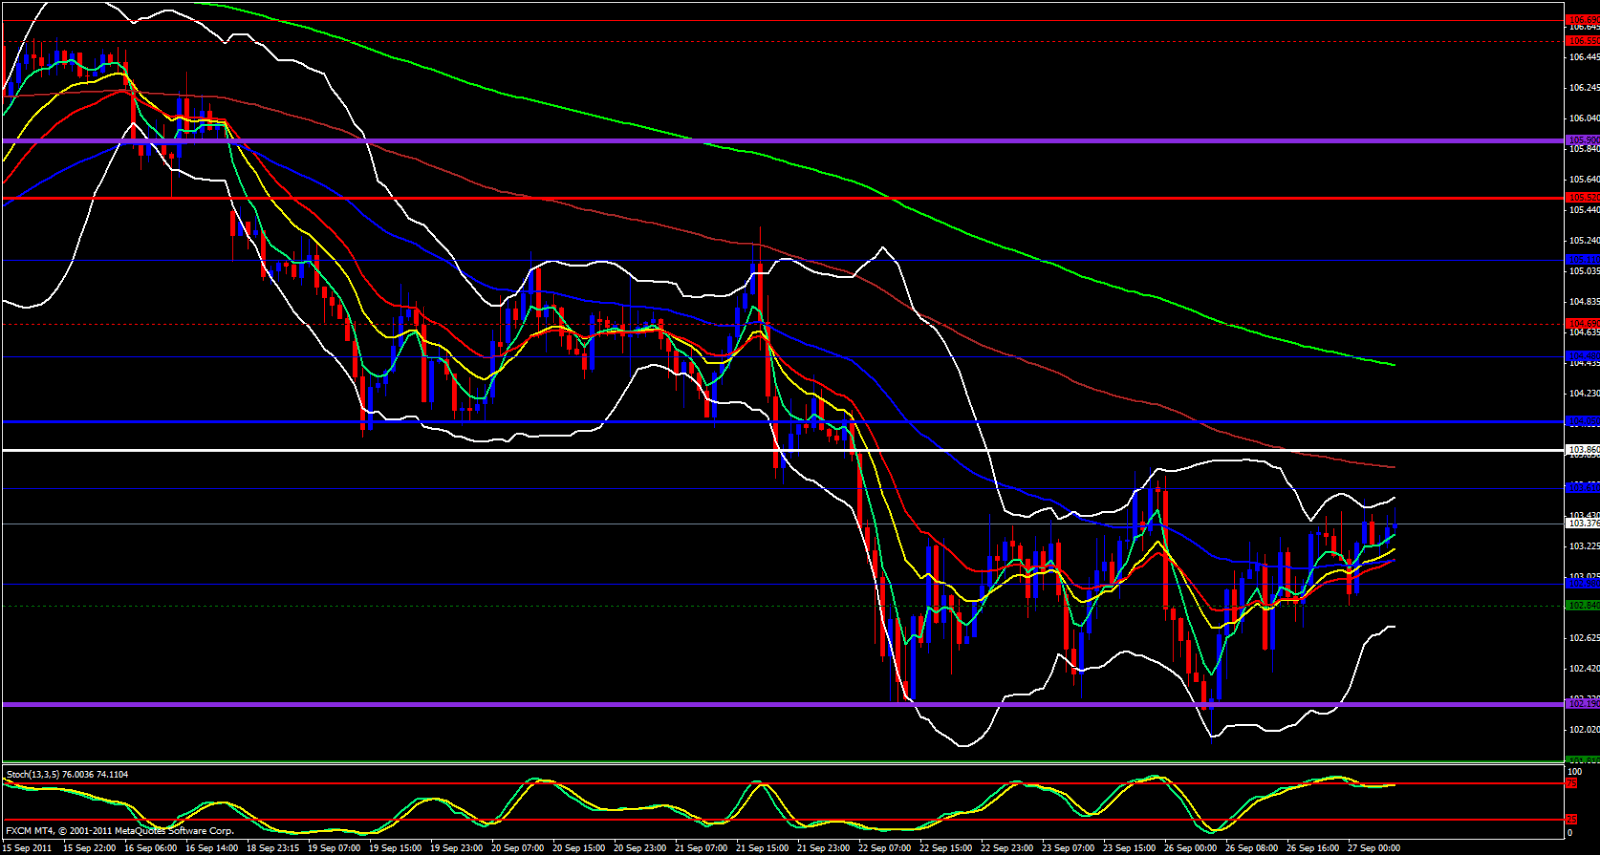
On the hourly chart we are up against visual resistance, ema's are braided not really providing and direction.
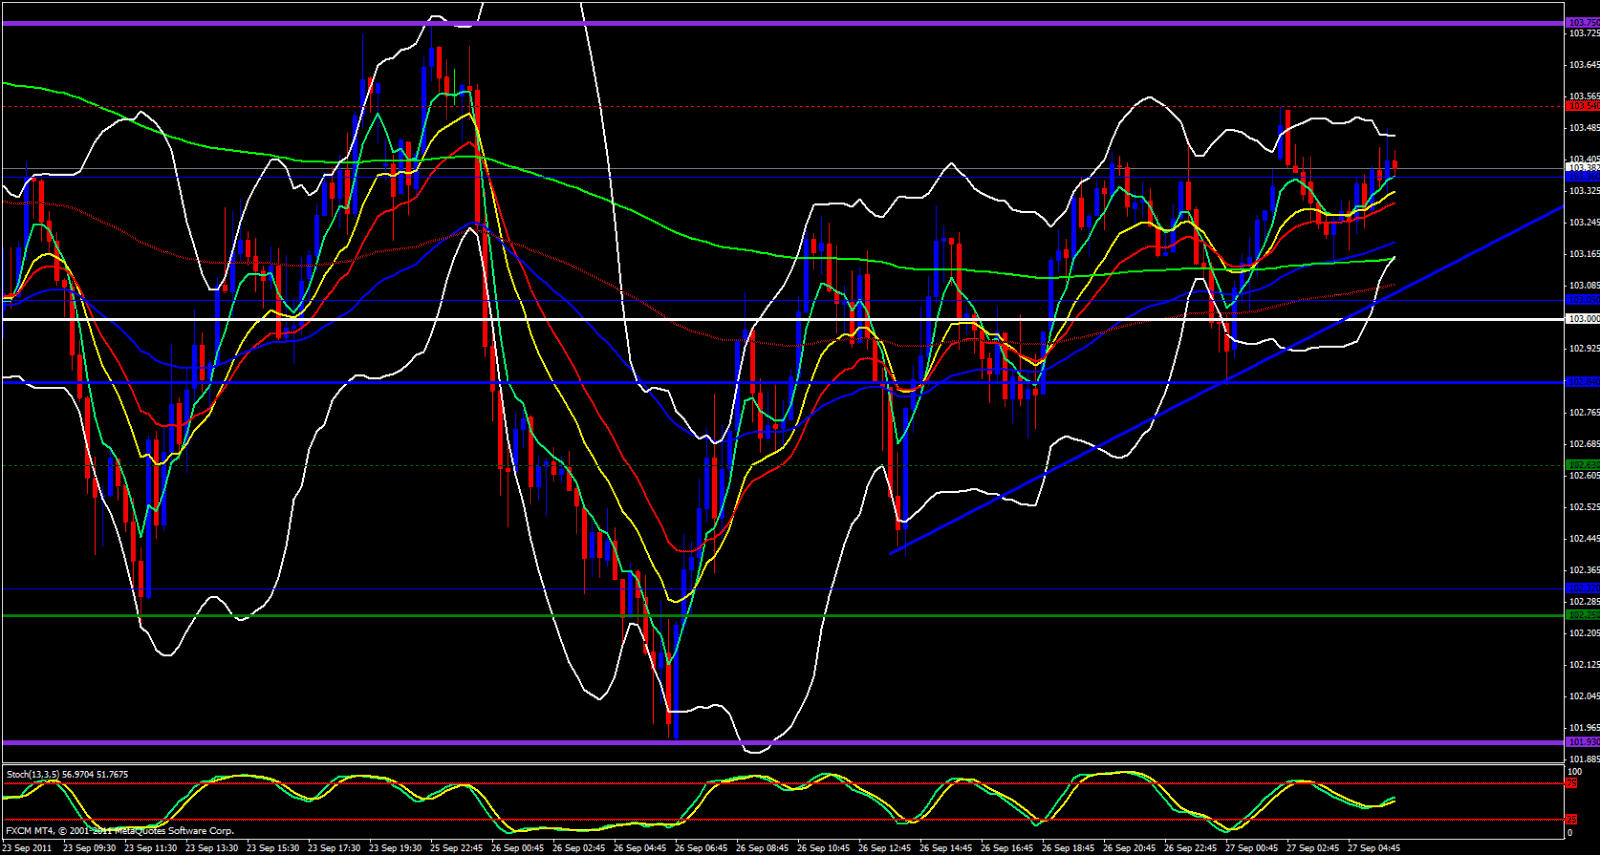
Finally, the 15 minute chart tells me no more than the hourly except that we have been making higher highs and higher lows which are bullish in nature. A long should only be considered if 104.00 is broken then retested then a sign of green but watch out for the hourly 233 ema. Shorts should only be considered if a break below 102.85 occurs after a retest then a bit of red. Try to keep stop losses no more than 20 pips away from entry.


