By: Doug Rosen
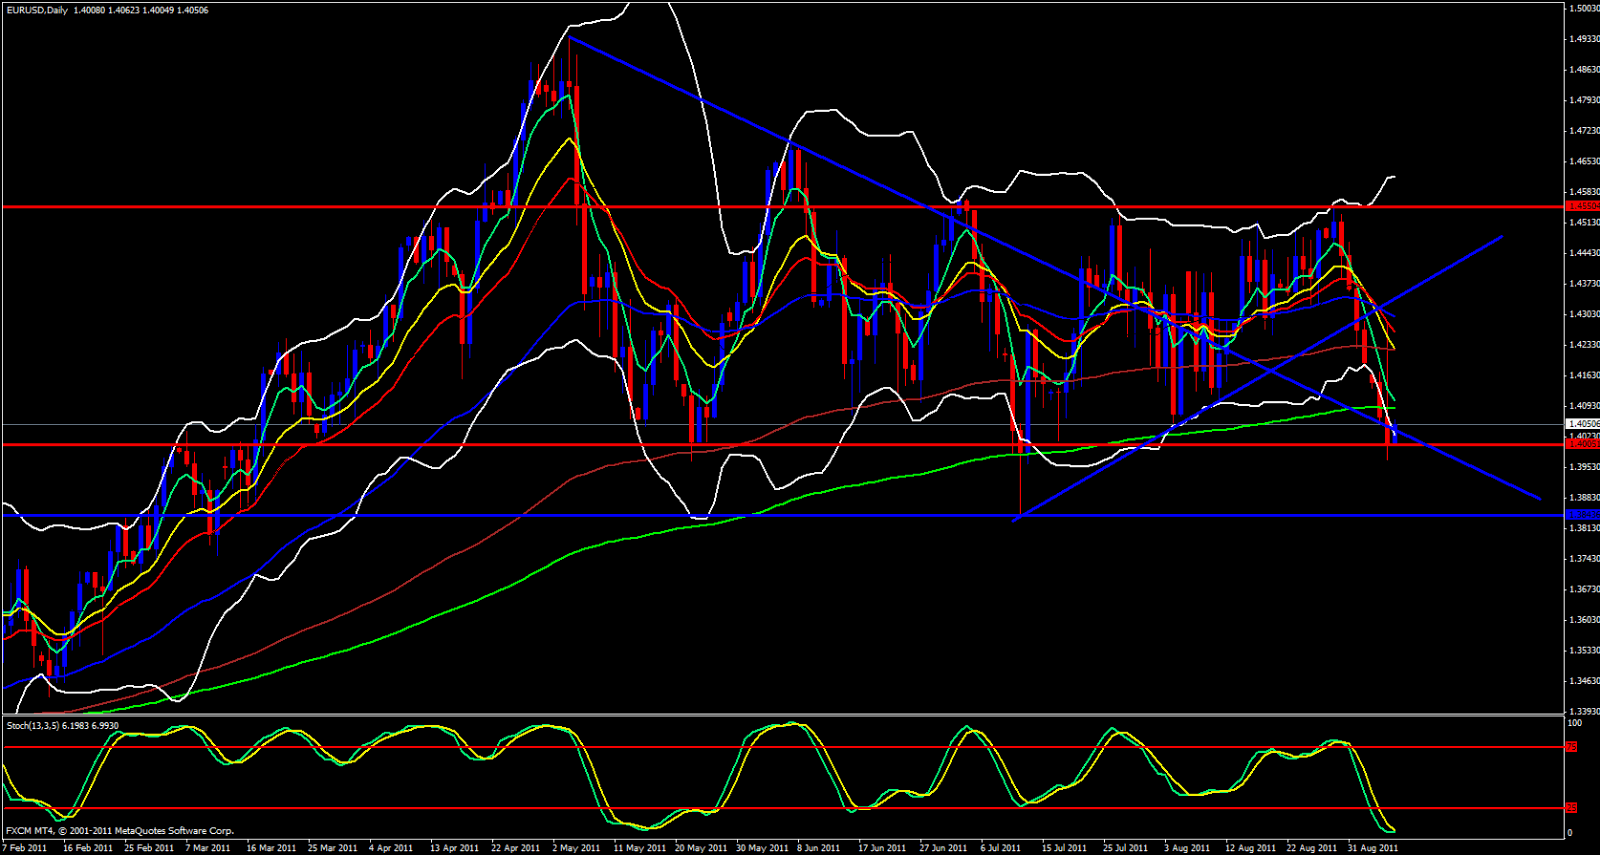
Due to yesterday's negative CHF CPI report the USD received a lot of strength so today we see a rather strong USD. If you take a look at my review of the EUR/GBP you will read that I am bearish on that pair which translates into EUR weakness. So, with all that being said I would expect to see the USD overpower the EUR so we are thinking bearish on the EUR/USD. Taking a look at the daily chart we are at the bottom of the range but yesterday's daily candle wicked below my daily support line. Of course this has happened a few other times in the past few months but now we are below the 233 ema and the the lower Bollinger Band is wide open. I also want to quickly point out that on the weekly we are having ema crosses to the downside as well as that lower Bollinger Band is also opening to the downside with Stochastics crossing down in the trade zone.
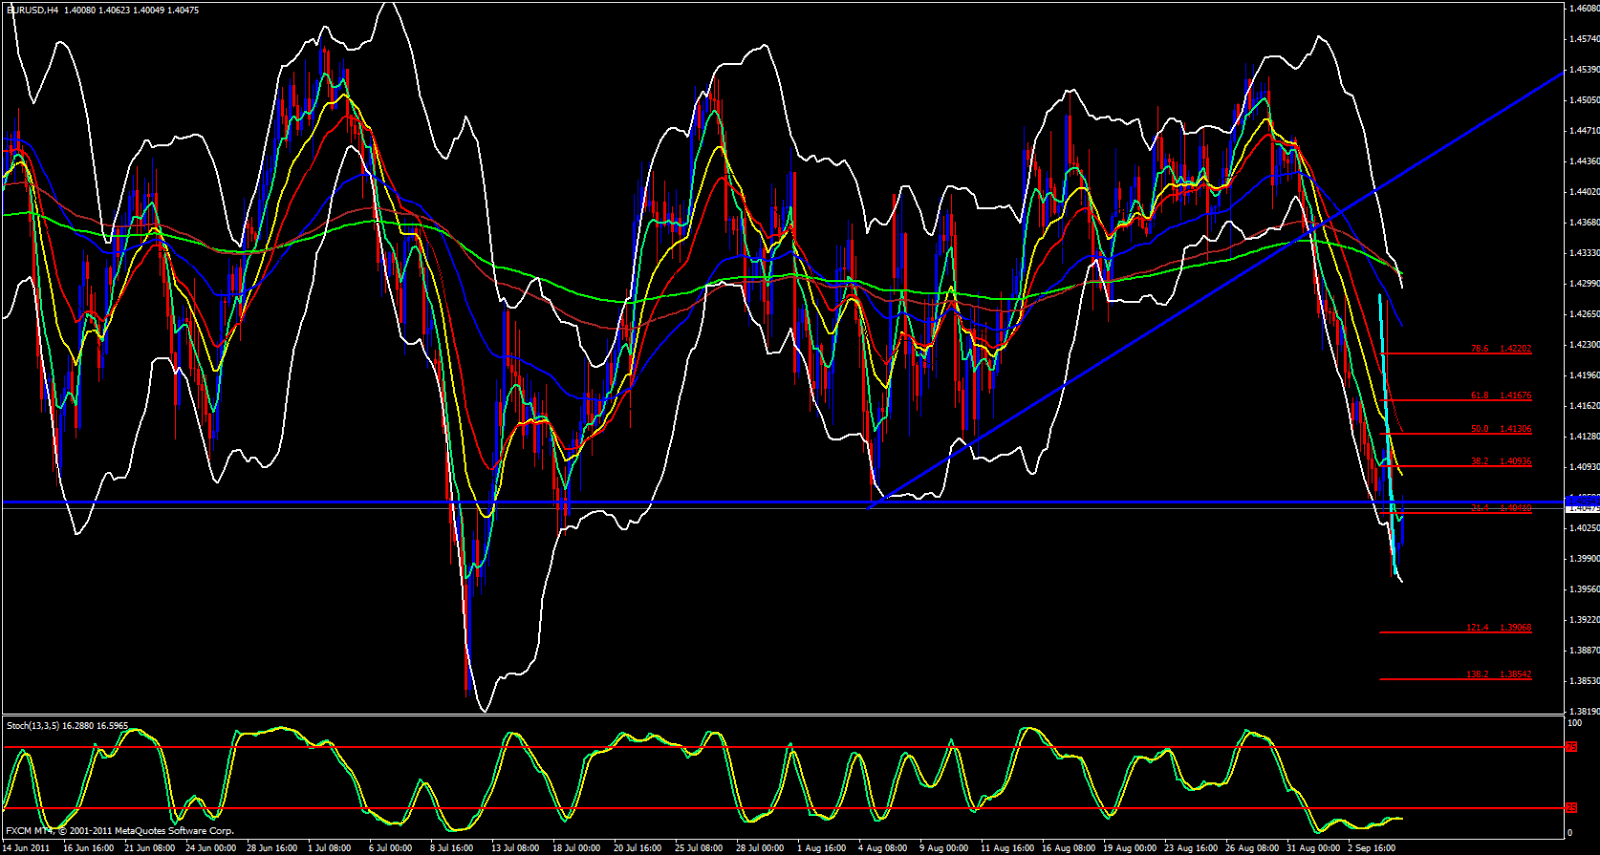
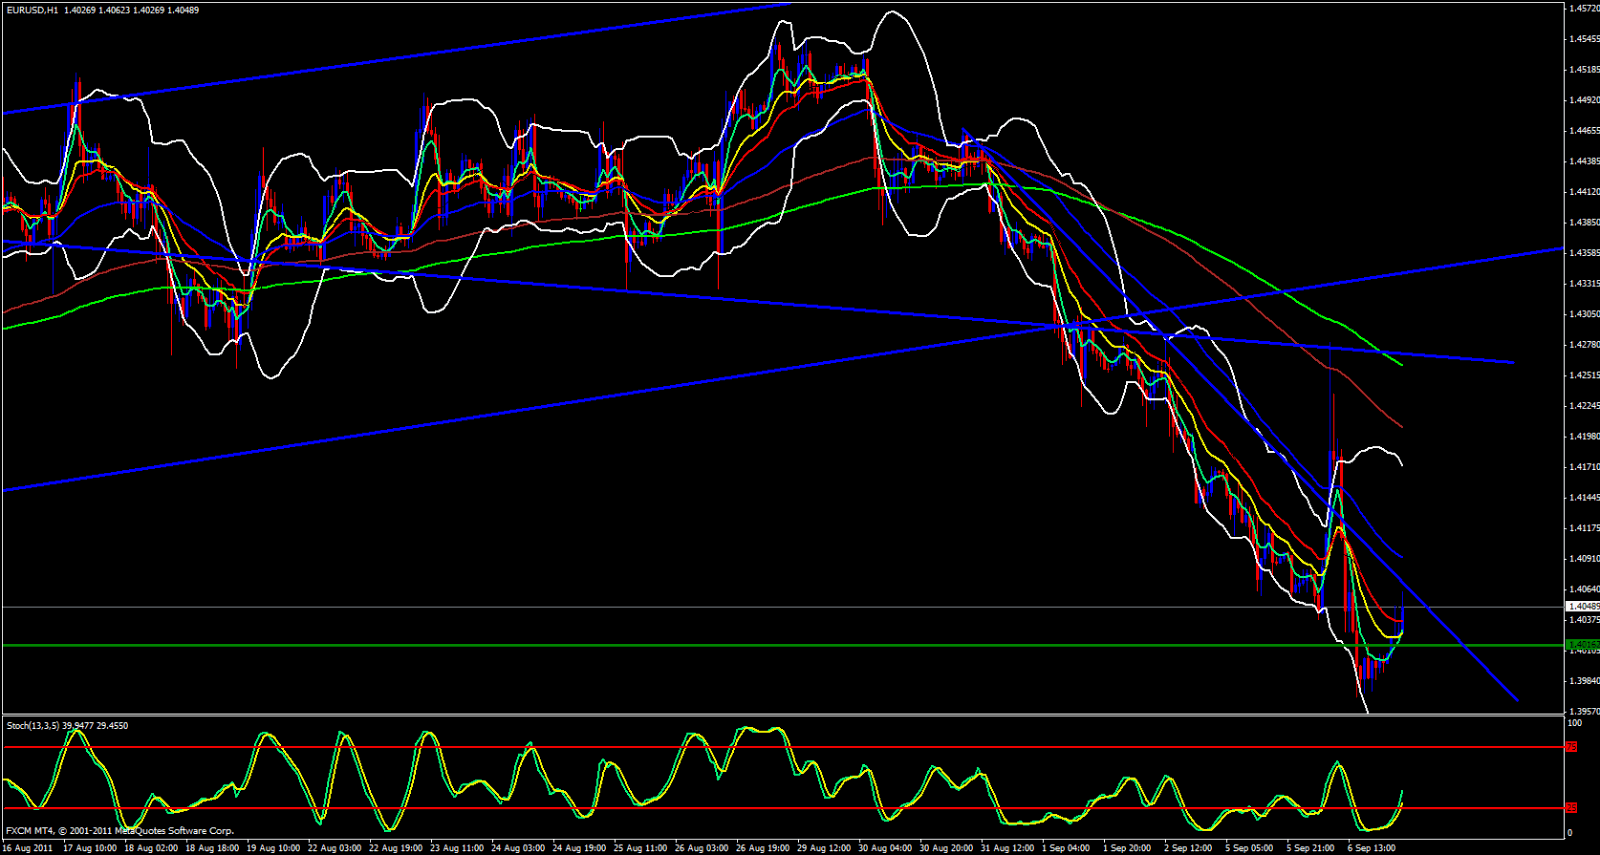
Moving over to the 4 hour chart all ema's are pointing down and below each other in their proper sequences with the 144 crossing below the 233, within the Bollinger Bands with the lower Band open and pointing downward, lots of angle and separation between the ema's and Stochastics seems to want to stay at the bottom and wants to make another cross in the oversold zone which is a bearish sign. Now, taking a peak at the hourly it is clear we are heading up a bit but that appears to me just as a normal retracement and I would expect price to hit and bounce off either the descending trendline or the 55 ema just a tad above it. At the time I am writing this review we are below yet retesting last months low. We are also retesting the Weekly S1 overlapping my descending trendline. We are also just below the daily Central Pivot Point of 1.4084 If price was to reach that level I would surely take my short off that CPVP and set my SL just above the psychological level of 1.4100 and set a profit target somewhere in between 1.3984 - 1.3971 which is the zone between the daily M2 and yesterdays low.


