By: Doug Rosen
Retracements of the previous drop to be expected:
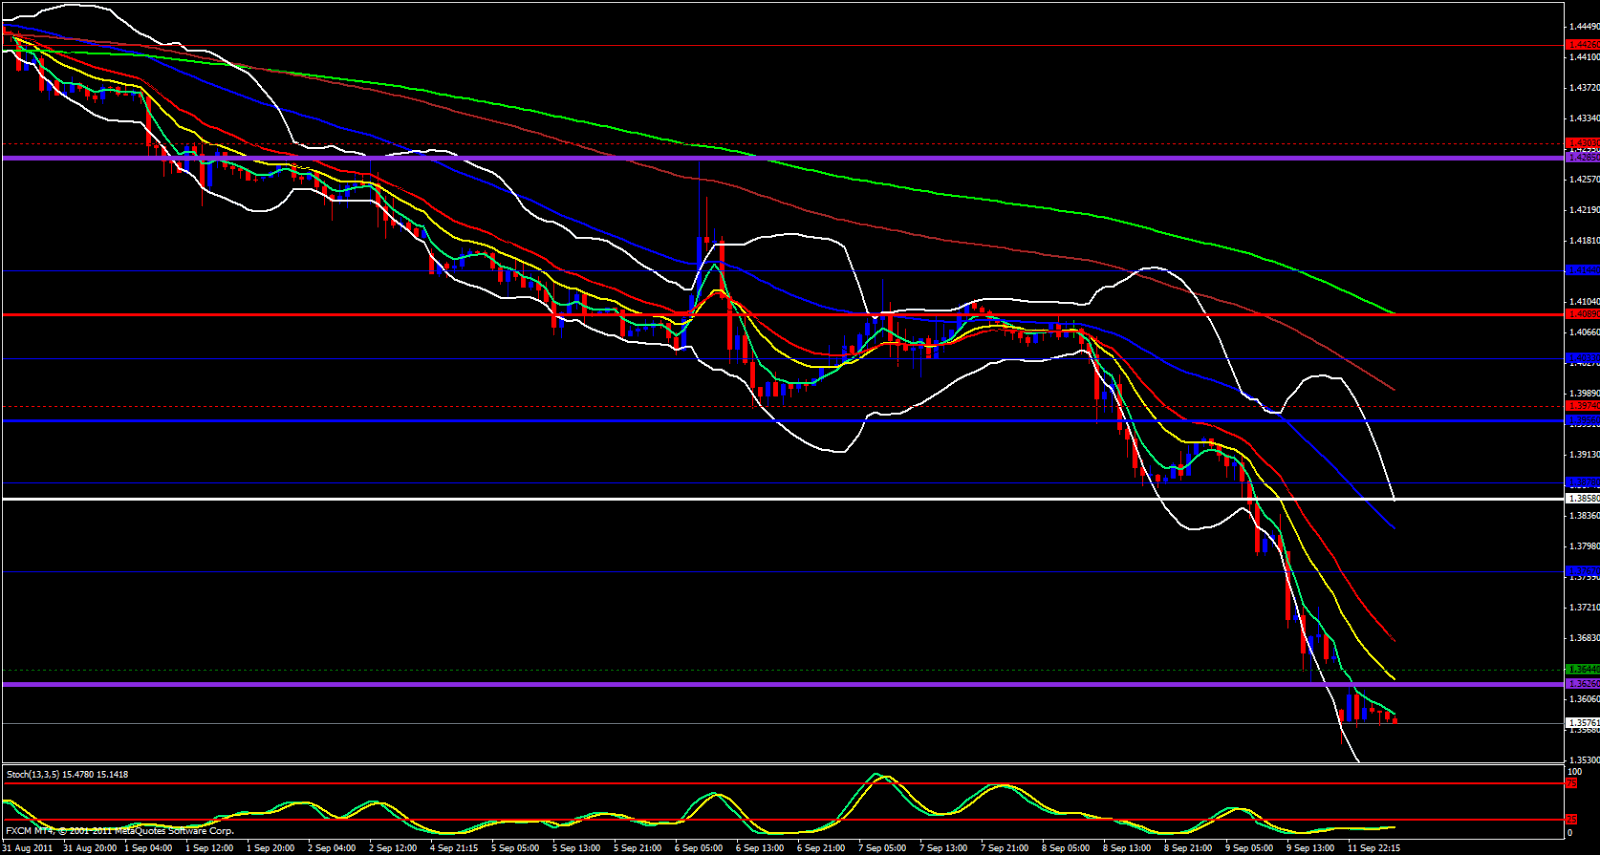
As I observe this pair there is absolutely no doubt it has been in a downtrend for the past couple weeks and there is really no reason for this down trend to end, however, I believe a slight retracement is due before price continues downward. Looking at the Weekly chart I see we have broken the 233 ema yet we are outside of the lower Bollinger Band and a distance from the ema's.
On the daily chart we are riding the lower Bollinger Band but 140 pips away from the 5 ema and Stochastics is in the over sold zone. We have a reversal candle formation on the 4 Hour chart, about 60 Pips away from the 5 ema, Bouncing off the Lower Bollinger Band and just pierced the Monthly S3 Reversal Pivot. Taking a look at the hourly chart I see that the 5 emas is trying to rollover to the upside and the Stochastic is in the over sold zone. For price to travel much further it will need to at some point meet back up with at least the 5 ema on the 4 hour chart or as high as 1.3717 to retest the Monthly M0 and this would coincide with the Hourly 21 ema.
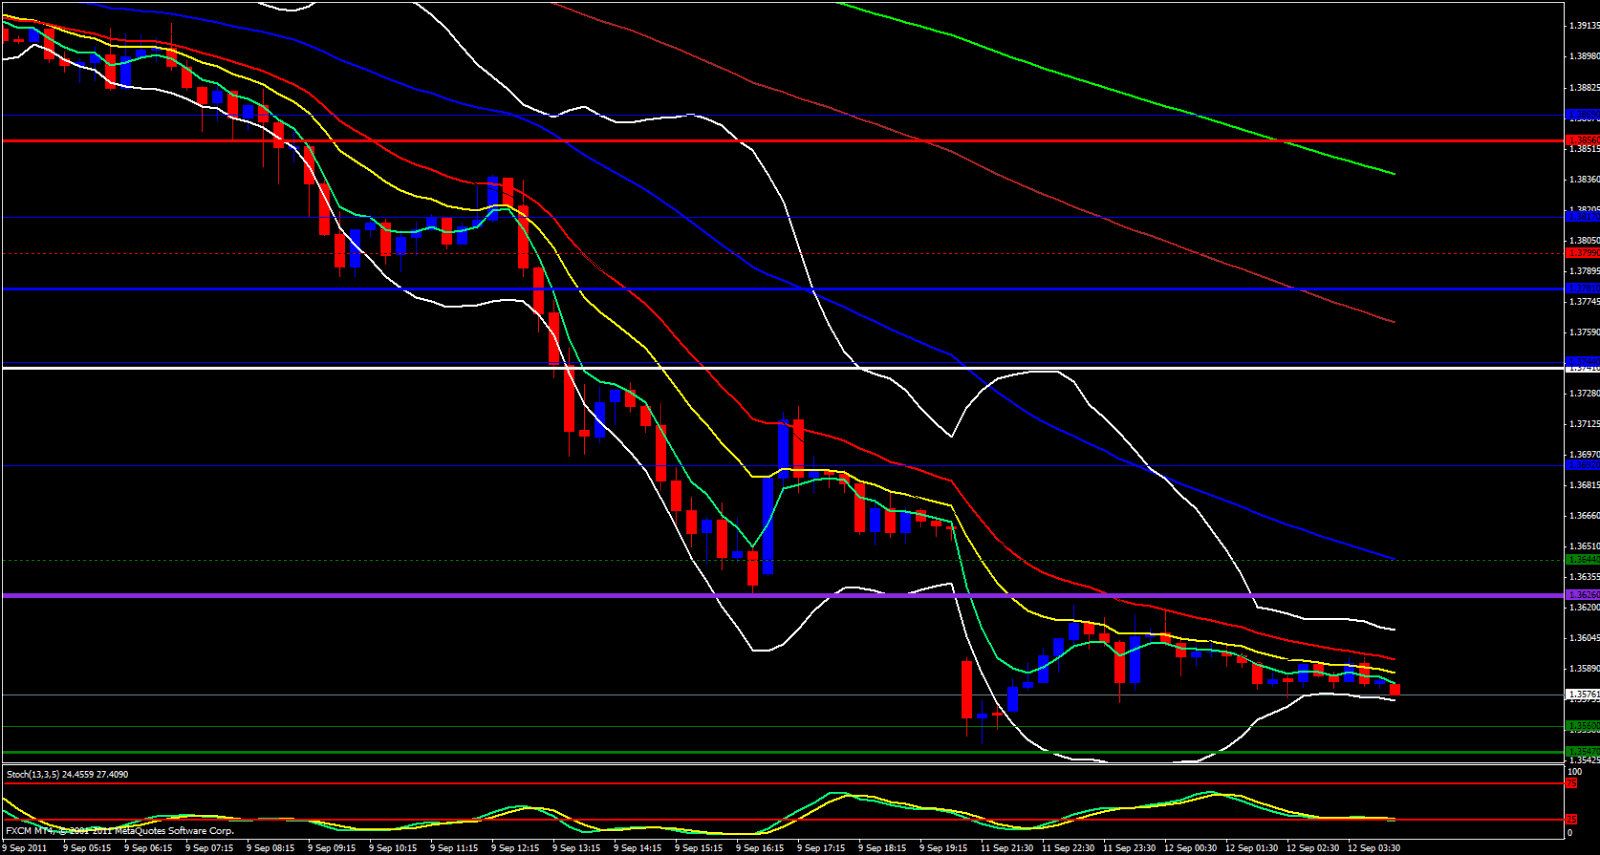
Taking a glance at the 15 minute chart I do see that price is in a consolidation phase and upper and lower Bollinger Bands are narrow which could soon lead to a Bollinger squeeze. I am watching for price to finally retrace back up to at least the 1.3644 area since this area overlaps with the 15 min 55 ema Then to consider a short but setting a tight stop of 10 - 12 Pips. If price was to break 1.3644 region then I would wait for pull back to the scene of the crime and look to go long as high as 1.3700 where there will probably be some hesitation then price could continue to go as high as 1.3740 before it continues downward.
.gif)

