By: Doug Rosen
Retracements of the previous drop to be expected:
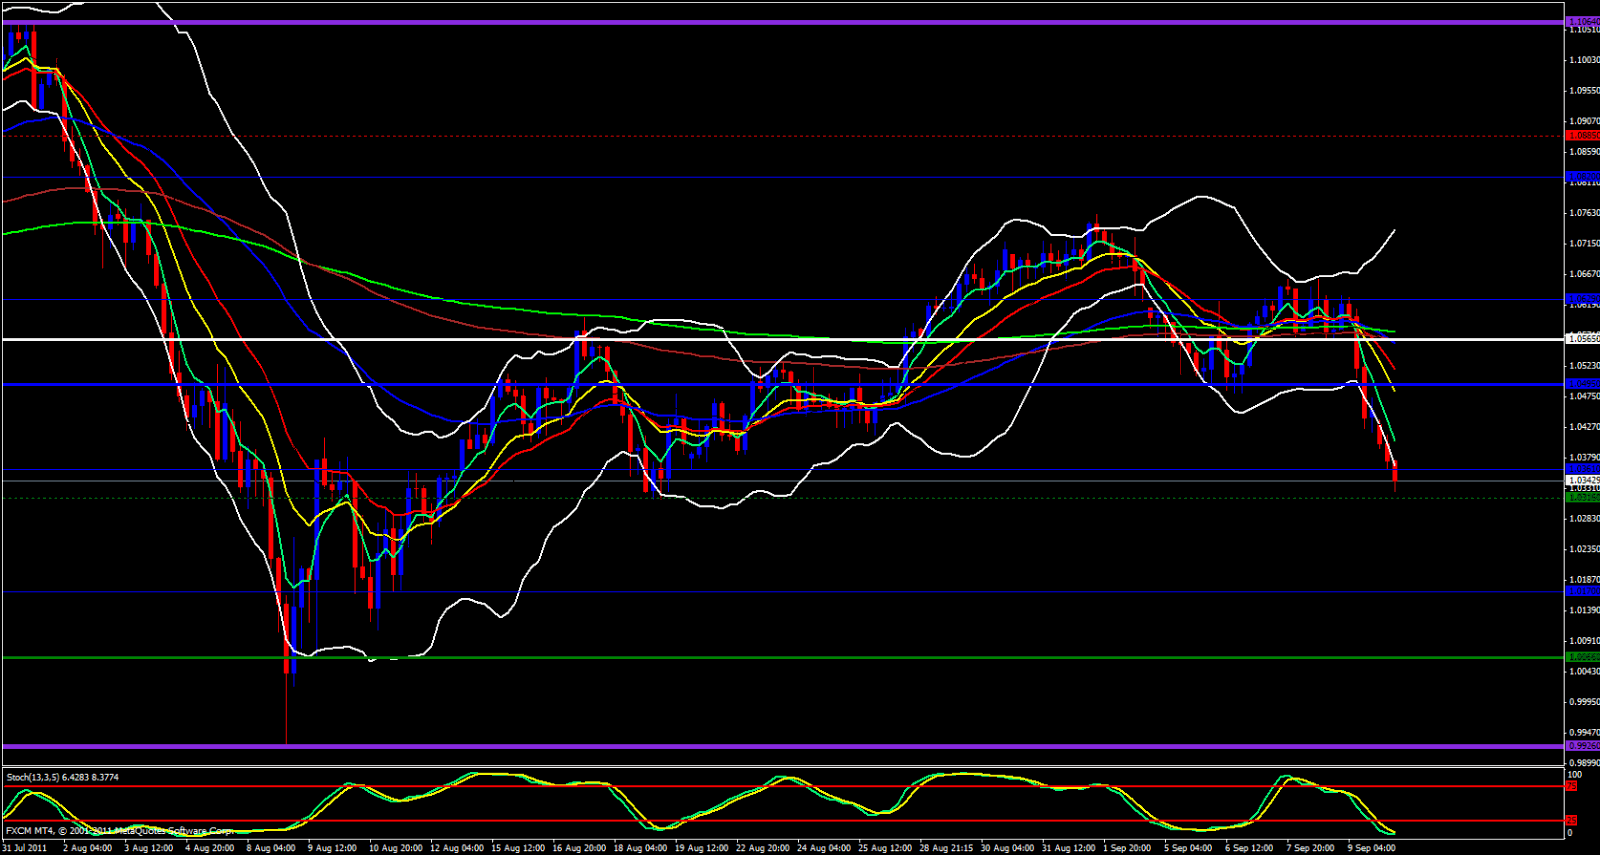
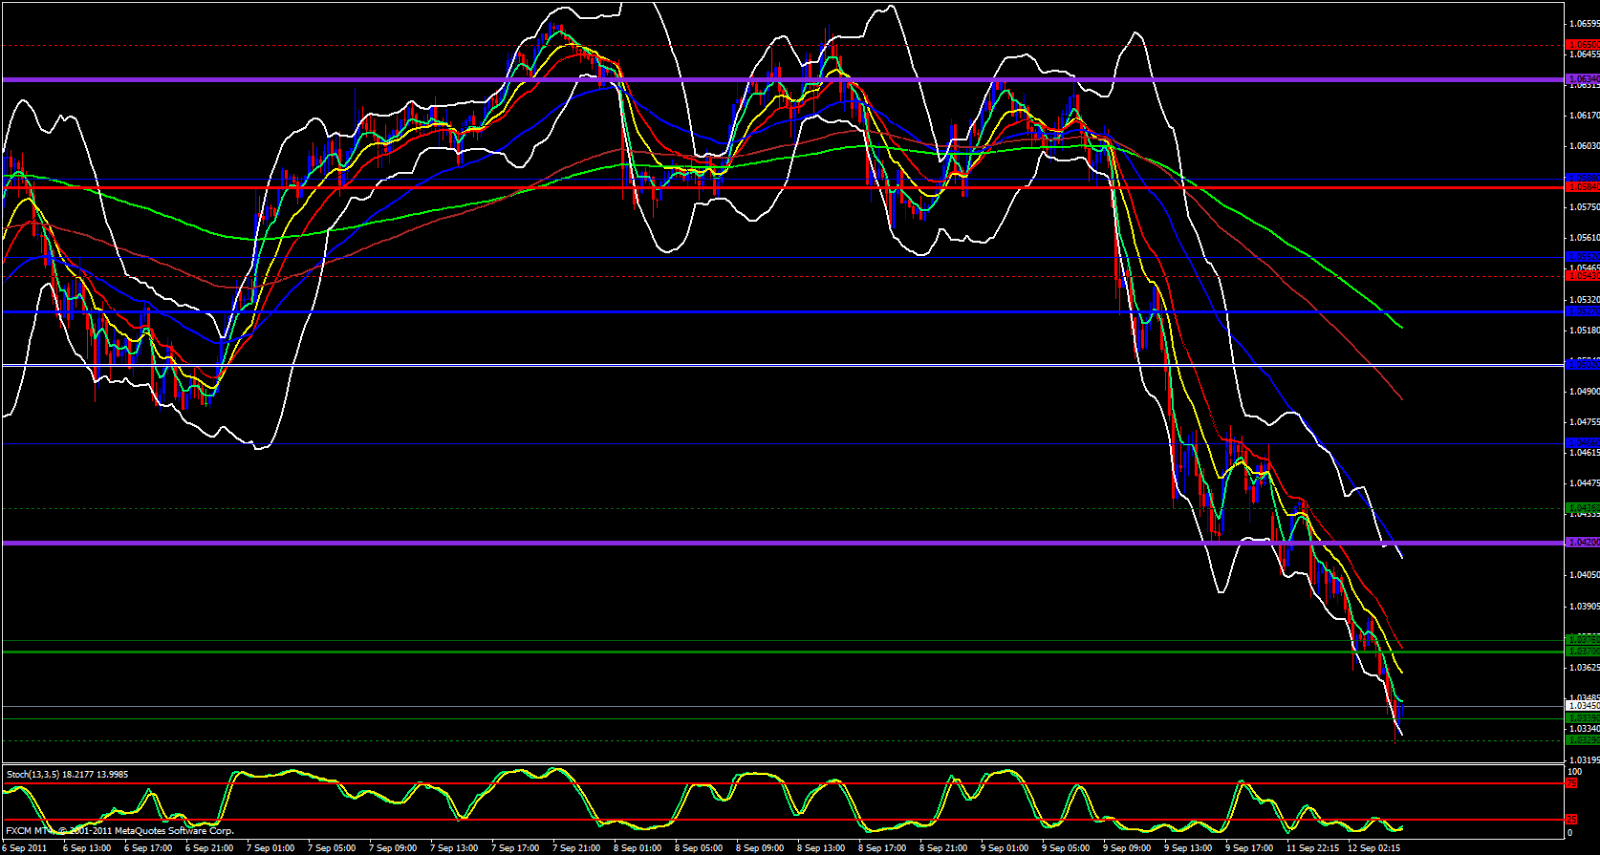
This pair continues bearish however, it is at a daily 50.0 Fib to the upside overlapped with a daily 233 ema and lower Bollinger Band, approaching the Stochastic oversold zone.The daily 5 ema is up around 1.0440 and we are just above the Monthly M2, just above the weekly M1, just above the daily M1 with Stochastics in the oversold zone on most time frames.
Taking all this in consideration I expect a retracement back up to the upside imminent and I would feel very reluctant to look for shorts with this paid before we make some type of a reasonable retracement back to the upside before further continuation to the down side. Always remember, price and the 5 ema have to meet up sooner or later. but I would watch out for retracements to the 1.0370 - 1.0400 area before continuing downward. 1.0377 also looks like a decent area to catch a short to the 1.0330 area.


