By: Doug Rosen
Looking at the weekly it appears that price is setting up for continuation to the upside. The weekly Stochastic is in the trade zone crossing up. The Daily has ignored the fib of the previous swing down and is treating the fib levels as a stairway going upward.
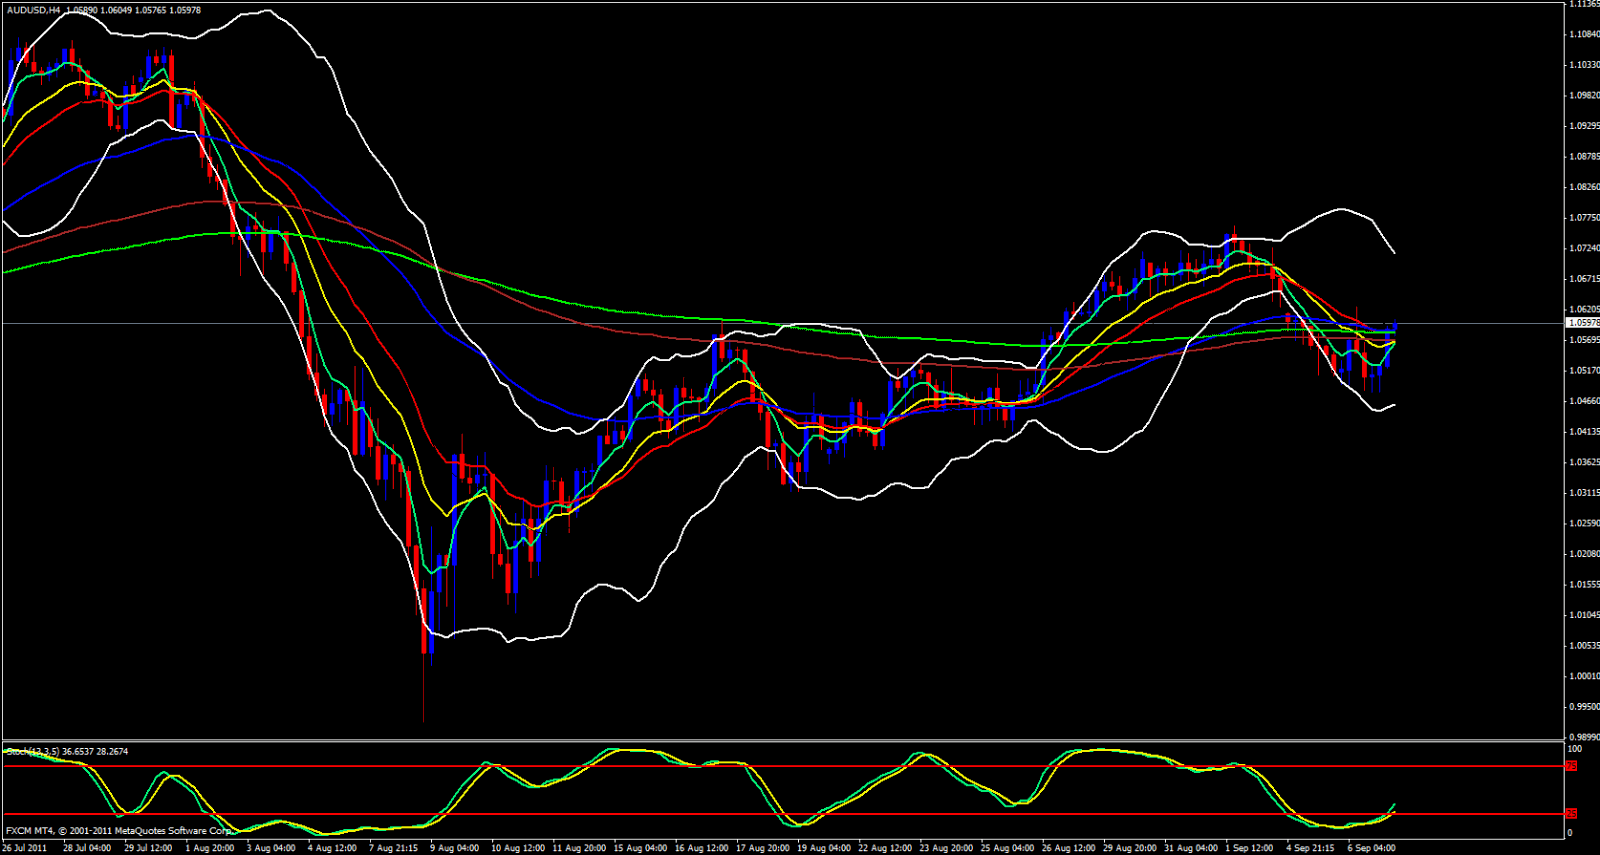
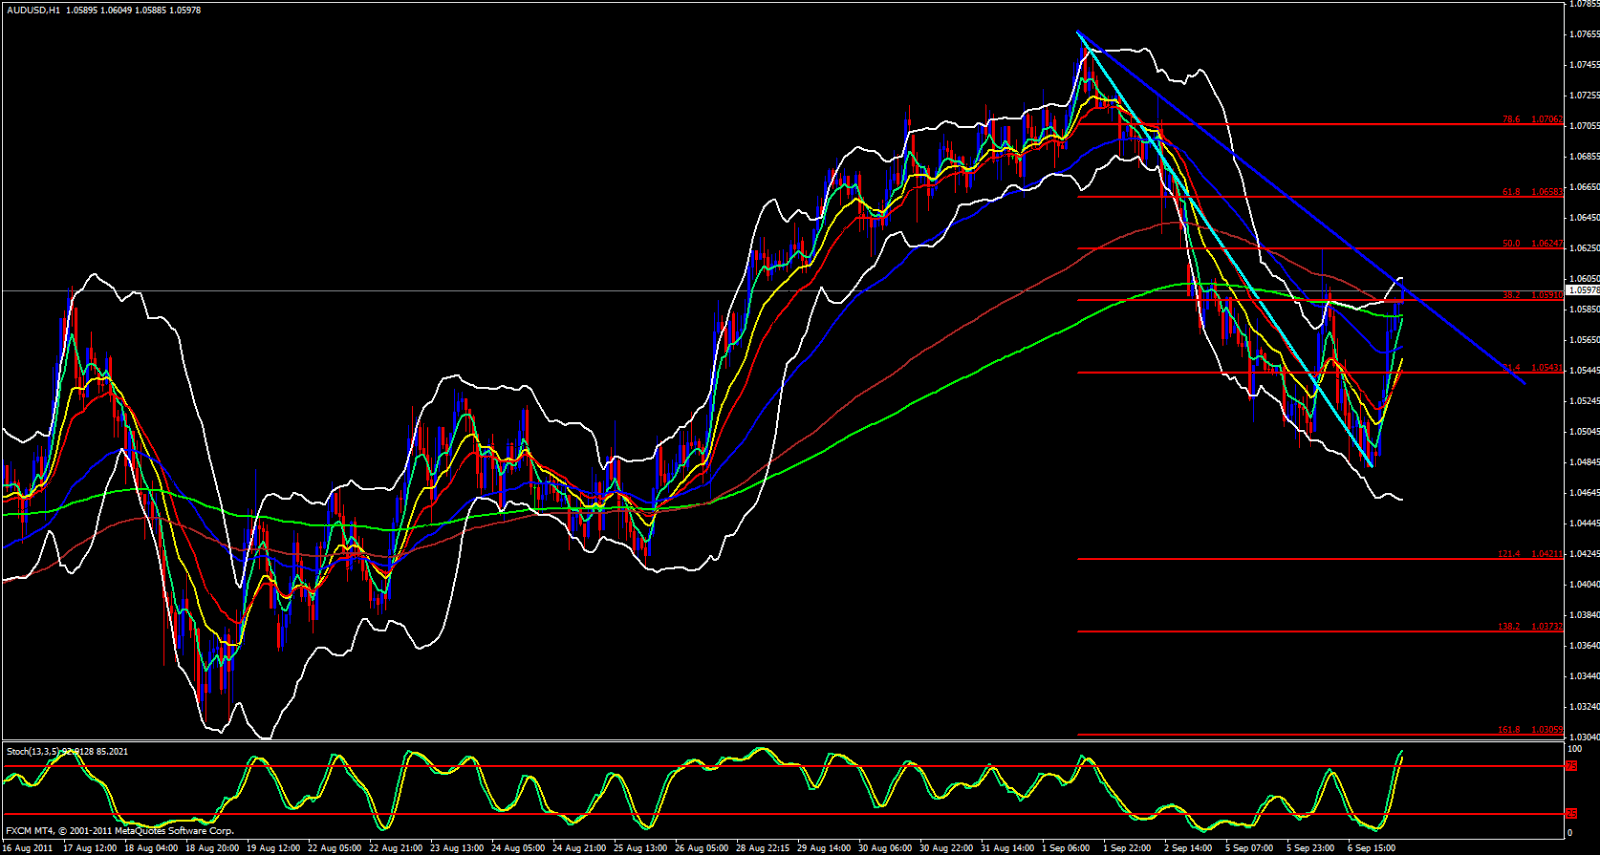
Taking a look at the 4 Hour I see the Stochastics is heading into the trade zone from the over sold zone and the 5 ema is pointing up and poised to cross the other ema's and to give price a lift upward. On the hourly chart the upper bollinger band has opened and is pointing upward, price is riding the 5 ema and the 5 emas has crossed the 13, 21, 55 and about to cross the 233 and is already piercing a trend line of mine it will most assuredly bust.
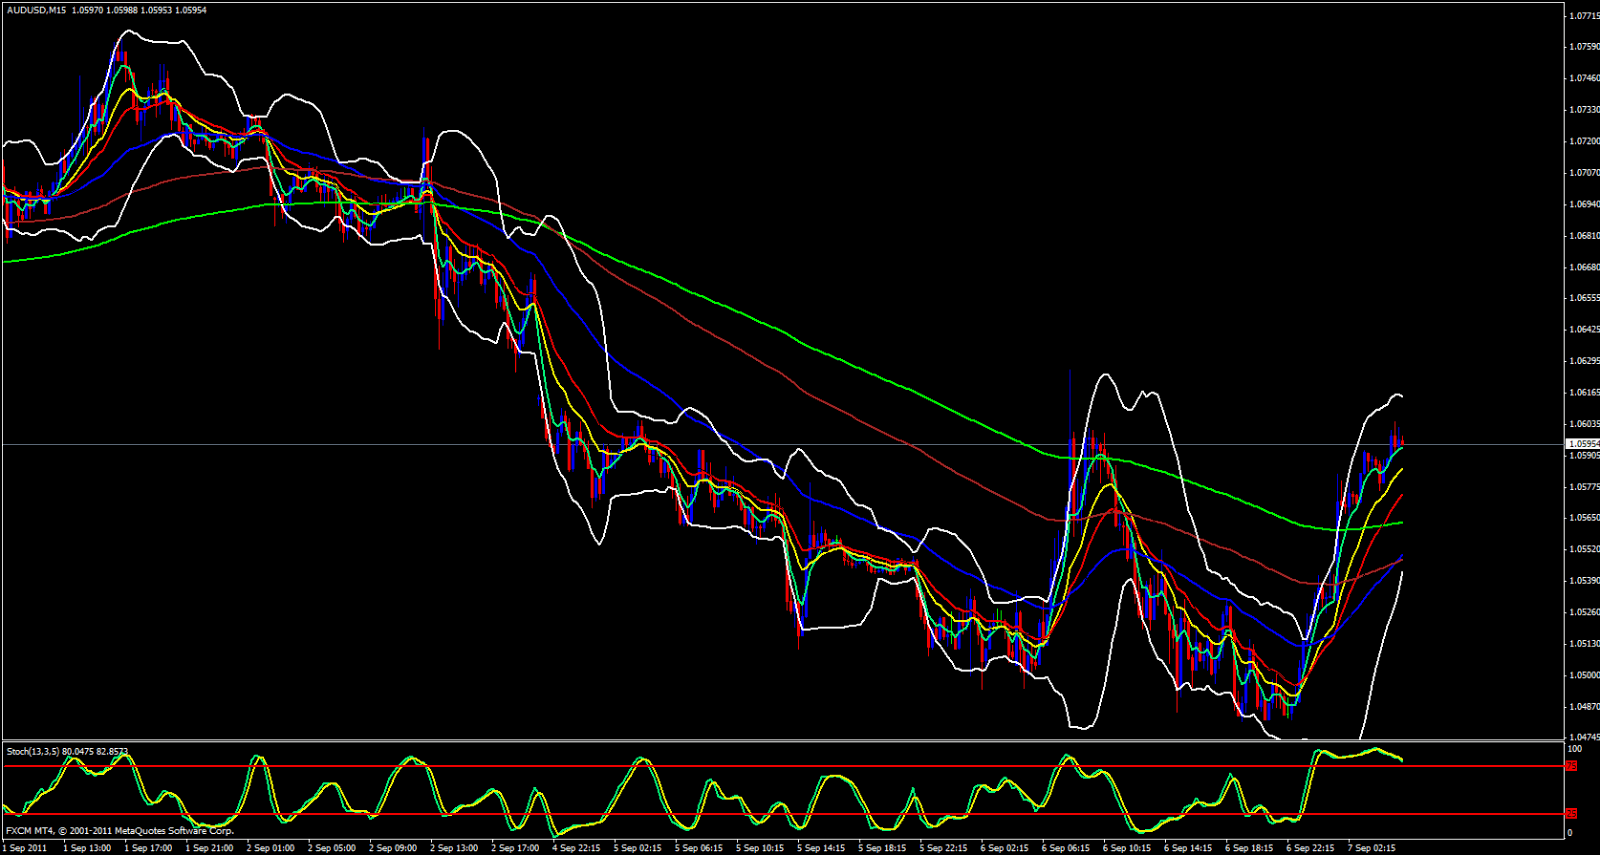
On the 15 minute chart we have already busted the 233 ema, Bollingers are wide open to the upside and the stochastics wants to cross downward only because it will need to recycle itself so that it can head back up. Taking a look at the Pivots the Monthly Central Pivot has been busted and the 4 hour 13 ema is crossing that central pivot. We are piercing the Weekly M2 and once this is broken I expect price to switch gears to a higher speed. Price is above the daily R1 on its way to the M4 overlapped with yesterdays high. I am only thinking bullish with this pair so I would look at longs based on two scenarios. First scenario price will bust the 1.0630 level, hit the 1.0657 level then do its fib back to 1.0630 and that is where I will take my long and i would set my stop within 20 pips from price. The second scenario would be that price will bounce down when it touches 1.0630 since that does happen to be the daily M4 overlapped with yesterdays high, a tough nut to crack the first time around, then bounce down to 1.0595 area, take my long and set my stop loss at around 1.0560 which is just below the monthly central pivot point to give this pair some room to breathe. Profit target for this pair should be around 1.0660 - 1.0675 which is the Weekly central pivot point and Daily R2 area.


