By: Mike Kulej
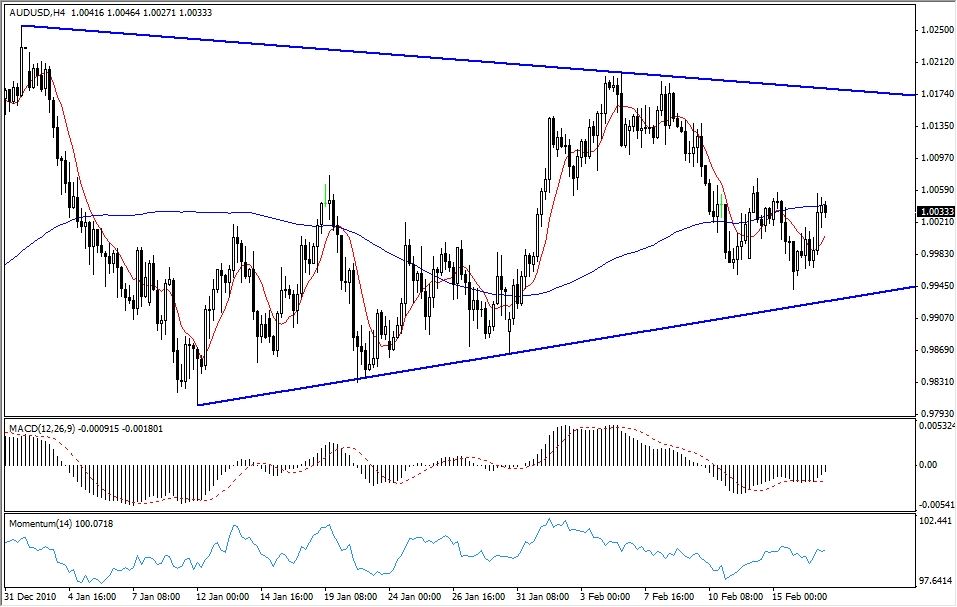
The Australian Dollar has slowed down its torrid advance recently. After making an all time high at 1.02555, it fell to 0.9800 in early January. Since then, however, the price has been drifting sideways, moving in ever-smaller swings.

This lack of direction is a very typical behavior, especially after a large move, as it is the case here. Unfortunately, this kind of price does not provide many clues about the future direction. Charts produce neutral formations, like triangles, flags or pennants. That is what we can see forming on the intermediate term chart of the AUD-USD – a pennant.
What to Expect
As the price gets ever close to the apex of this pattern, we can expect a more decisive move to take place soon. It will be unmistakable when it comes, because the price will penetrate either through the resistance or the support provided by this formation. We should not have to wait much longer – at this point the pennant is only 200 pips wide and getting leaner.
Whichever way the breakout happens, it should be accompanied by an uptick in activity of other technical indicators. For example, the Momentum should follow the price and spike visibly from its current neutral reading. That will indicate the most likely direction for the next larger price swing in the AUD-USD.