By: Mike Kulej
The ever-popular “cable” as the GBP-USD, is typically one of the more volatile currency pairs available for trading. With its strong moves and sudden turns, it provides plenty of trading opportunities, on both short and long-term time frames.

Even if the British Pound-US Dollar pair still tends to move more than other currencies, its volatility has diminished dramatically during the past two years, as is noticeable in both of the size of its price swings and the average ranges. This is true for all time frames.
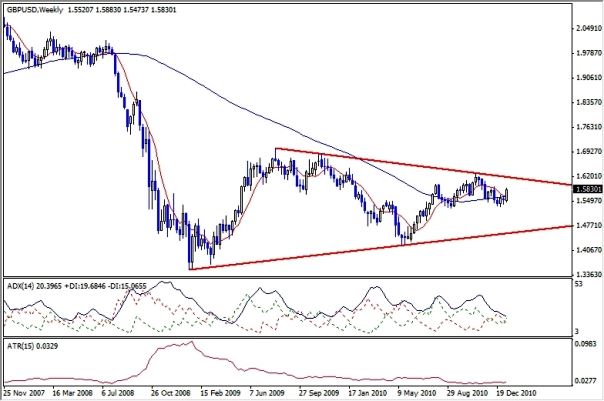
On the weekly chart we can see how following the financial crisis of 2008, the GBP-USD has been making ever smaller moves. Each time the price changes direction, the next price swing covers less ground than the preceding one. The ADX indicator shows a very low reading and is sloping down, meaning no discernable trend. At the same time, the Average True Range indicator sank to the lowest level in years.
This state of limbo might not last much longer. The price is forming a pennant and is slowly approaching its apex. It is reasonable to expect an increased activity in the GBP-USD soon. For this large time frame, it probably means within few months, but it might pay to get ready - the breakout could result in a huge price move.