By: Mike Kulej
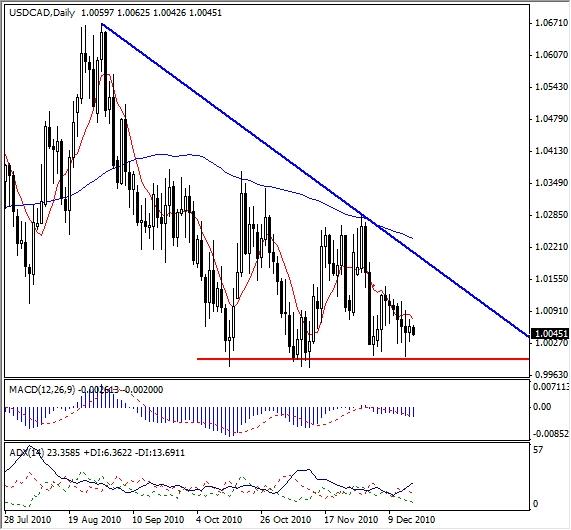
One of the currency pairs, which do not get many headlines these days, is the USD-CAD. For a good reason – it is not moving much. Since the early October the largest price swings was about 350 pips, as plotted on the daily chart, with the following moves getting progressively smaller. However, that could change soon.
The price action revolves around the parity level, or to be precise, is concentrated just above it. In general, the trend is down, but the USD-CAD just cannot penetrate the 1.0000, finding a solid support there time and time again. On couple of occasions, the price dipped under the parity, but failed to close there.
In the process, the USD-CAD created a triangle, and the price is approaching its apex. Chances are that a more direct move will happen soon. Since the action is oriented heavily at or near the parity, it means that market forces are “pulling” this pair down. This increases the possibility for the next move being bearish.
Other indicators support such outcome by a slim margin. The MACD is negative, although the reading is very close to zero. However, the ADX indicator is more telling – it began to rise, meaning that a bearish trend is developing. In the end, however, the price itself will decide the direction of the next move, so both sides of the triangle should be watched closely.