By: Mike Kulej
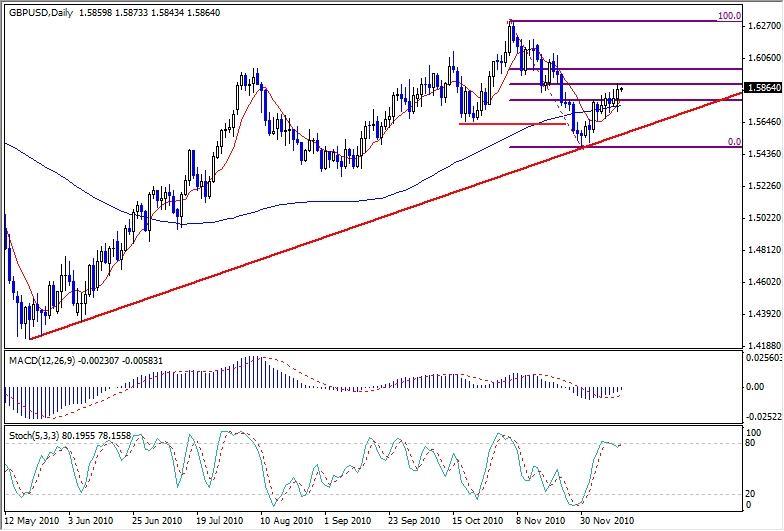
The GBP-USD has been in an uptrend for a long time now. Since May, this pair rallied from 1.4300 to 1.6300. However, most of the gains were made in the early stages of this run. The later stages brought predominantly sideways move, with the exception of a brief period when the GBP-USD spiked up to 1.6300.
After making this high, the price dropped to 1.5482, which puts this entire rally in question. While the GBP-USD found support at a trendline, it also moved under the most recent low as well as the 100 SMA, both negative signs. Currently, the price appears to be oscillating around the 100 SMA, a sign of indecision.
This chart might provide additional clues during the next few days. If the uptrend is to continue, we should see the MACD to move above the zero line. Also, the price should easily cross through all the important Fibonacci retracement levels for the 1.6300- 1.5482 price swing and approach the last high.
On the other hand, if the market creates a bearish reversal candlestick, especially at one of the Fibonacci levels, more price correction could lie ahead. The Stochastic indicator is overbought and would support a reversal in near future. In short, the next few days may indicate the longer-term trend in GBP-USD.